
Where homeowners are trapped by 74% mortgage cost hike from pandemic-era low rates
Where homeowners are trapped by 74% mortgage cost hike from pandemic-era low rates
The past two years have seen a significant shift in the housing market, with mortgage rates rising from roughly 3% in 2021 to over 6% in 2023. This increase has led to a substantial surge in annual mortgage spending, leaving many homeowners feeling trapped. Compounding this issue, the national average home value has also risen by 18.1% during the same period. The combination of these factors, along with a decrease in housing supply and demand, has created a challenging environment for homeowners looking to sell and move.
To uncover where homeowners feel most trapped in their mortgages, MoneyGeek analyzed data for over 312 metro areas across home values, historic mortgage rates, and housing supply and demand trends. While more factors are involved in purchasing or selling a home, the findings examine the waning flexibility of doing so in a heated housing market.
Key Findings
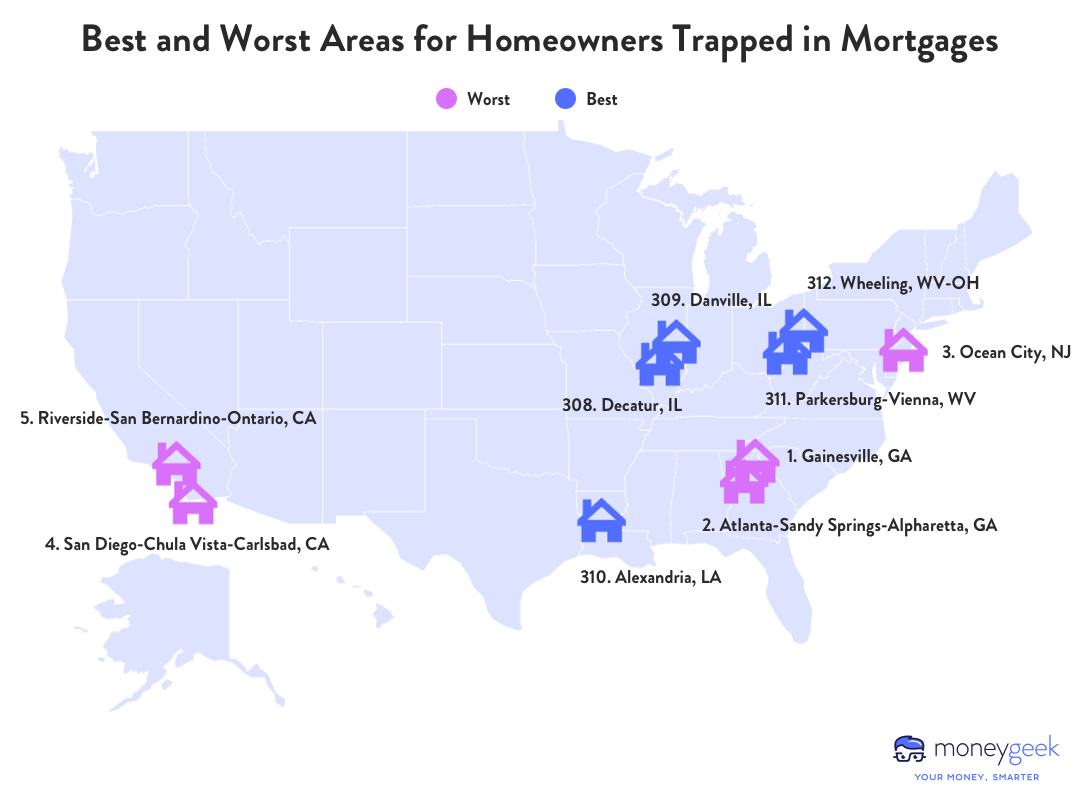
- The South is feeling the heat. Gainesville and Atlanta, Georgia, rank as the No. 1 and No. 2 metro areas where homeowners are most trapped in their mortgages. Homeowners looking to buy would face increases of more than 82% in annual mortgage spending. Further south, in the Naples-Marco Island area of Florida, mortgage costs have more than doubled since 2021.
- San Jose, California, has the highest average mortgage payment, which surged by 67% to $8,110 per month between 2021 and 2023, posing a challenge for budget-conscious homeowners. To manage this cost without exceeding 28% of income, prospective homebuyers would need an annual income exceeding $420,000.
- National housing trends reveal a tightening grip on supply and demand. In the Northeast, Ocean City, New Jersey, is seeing a 31.7% plunge in housing supply, while Austin, Texas, grapples with a 56.5% surge in listing-to-close time, signaling a dip in demand.
- The Danville, Illinois, metro area is a haven for homeowners, with a minimal $1,898 rise in annual mortgage spending from 2021 to 2023. Further south, the Midland, Texas, metro area saw the smallest percent change (50.4%), a modest increase compared to the rest of the country.
Double whammy: Homeowners in Georgia and coastal cities face rising mortgage costs and competitive housing markets
Homeowners in the Gainesville and Atlanta, Georgia, areas are among those feeling the most pressure. If they were to sell and buy now, they'd face an annual mortgage spending increase of over $10,500, a result of the 83.7% and 82.4% rise from 2021 to 2023. With new listings down by more than 25% and selling times up by over 27%, the market is less accommodating for those looking to move.
The heat is also on for homeowners in the Ocean City, New Jersey, and San Diego, California, metro areas. Selling and buying now would mean grappling with a surge in annual mortgage spending by $17,515 and $23,447, respectively. With housing supply dropping by over 29% and selling times increasing, the market is becoming more competitive, adding to the challenges of selling and moving.
A silver lining: Lower mortgage cost increases in West Virginia, Louisiana, and Illinois
For homeowners in Wheeling and Parkersburg-Vienna, West Virginia, the prospect of selling and buying a new home is less intimidating. Those who bought homes at 2021 rates in Wheeling would face an additional $3,025 in annual mortgage spending if they were to buy now, while in Parkersburg-Vienna, the increase would be $3,883 per year.
Similarly, homeowners in Alexandria, Louisiana, and Danville, Illinois, are less constrained by the current market. The increases in annual mortgage spending in these areas are 52.8% ($3,340) and 64.6% ($1,898), respectively. Coupled with minor decreases in housing supply and longer selling times, homeowners in these areas might find the transition to a new home more manageable, despite the overall challenging housing market conditions.
Behind the scenes: The role of supply and demand in the housing market
Current housing market trends are making it harder for homeowners to sell and move, particularly those who are locked in at lower rates and now face dramatically increased mortgage spending. From 2021 to 2023, the U.S. has seen a 17.9% drop in new listings and a 5.9% increase in selling times.
However, these trends aren't uniform across the country. The Northeast is feeling the squeeze of a 20.4% decrease in new listings, the most pronounced drop in supply. Meanwhile, homeowners in the West are dealing with the longest wait times for closing, with a 20% increase. If you're a homeowner in these regions, the current market trends could add to your challenges of selling and moving.
Metros with the largest decrease in housing supply
1. San Jose-Sunnyvale-Santa Clara, CA
2. Santa Rosa-Petaluma, CA
3. Ocean City, NJ
4. Santa Cruz-Watsonville, CA
5. Washington-Arlington-Alexandria, DC-VA-MD-WV
Metros with the largest decrease in housing demand
1. Austin-Round Rock-Georgetown, TX
2. Phoenix-Mesa-Chandler, AZ
3. St. George, UT
4. Provo-Orem, UT
5. Logan, UT-ID
Navigating the market: Essential tips for homeowners
Homeowners are navigating a challenging housing market. Metro areas like San Jose, California, and Austin, Texas, are seeing a surge in mortgage payments, contrasting with the more stable situations in places like Danville, Illinois, and Midland, Texas. The West and South regions are at the epicenter of these shifts, with housing supply and demand dwindling.
With rising mortgage rates, the financial hurdle of moving is becoming challenging for many. Fortunately, there are strategies available to help you navigate this landscape:
Transform your home with strategic upgrades.
HELOC rates have increased along with mortgage rates. But, if you've been lucky enough to see an increase in your home value, you may be able to borrow against it to perform some upgrades, which can make your home more attractive to prospective buyers.
Understand your buying power and the power of increasing your down payment.
Despite the current landscape, you may stand to make money selling your current home. You can also increase your downpayment to help keep your rates lower for your next abode.
Consider downgrading or moving to decrease your expenses.
Downgrading could mean opting for a smaller home or a property with less land, which can significantly reduce mortgage payments. Alternatively, moving to an area with a lower cost of living can offer financial relief for homeowners feeling trapped by rising costs.
Methodology
To determine where homeowners are most trapped in their mortgages, the study analyzed data for 312 metro areas across the U.S. and compared them across four key metrics:
- Two-year percent change in monthly mortgage spending. This is a comparison of the average mortgage rate for 2021 and the one-year average for June 2022 through May 2023.
- Two-year dollar change in annual mortgage spending. This is a comparison of the average mortgage rate for 2021 and the one-year average for June 2022 through May 2023.
- Two-year percent change in housing supply. This is a comparison of the average mortgage rate for 2021 and the one-year average for June 2022 through May 2023.
- Two-year percent change in housing demand. This is a comparison of the average mortgage rate for 2021 and the one-year average for May 2022 through April 2023.
To calculate mortgage payments used in the analysis, the study used the median home value in each metro area and assumed a 30-year fixed mortgage. For 2021 calculations, the study relied on an average mortgage rate of 2.96%. The 2023 calculations used an average mortgage rate of 6.28% from June 2022 through May 2023. Home value data comes from Zillow, and mortgage rates come from the St. Louis FRED Economic Data. The typical down payment for all buyers is 13%, according to the National Association of Realtors; as such, the study used this figure to calculate the down payment across metro areas.
To measure the impact of supply and demand on the housing market, researchers examined:
- Two-year change in new listings: This represents the housing supply in local markets.
- Average number of days for houses to go from listing to close: This represents the housing demand in local markets.
Data for both topics comes from Zillow.
This story was produced by MoneyGeek and reviewed and distributed by Stacker Media.