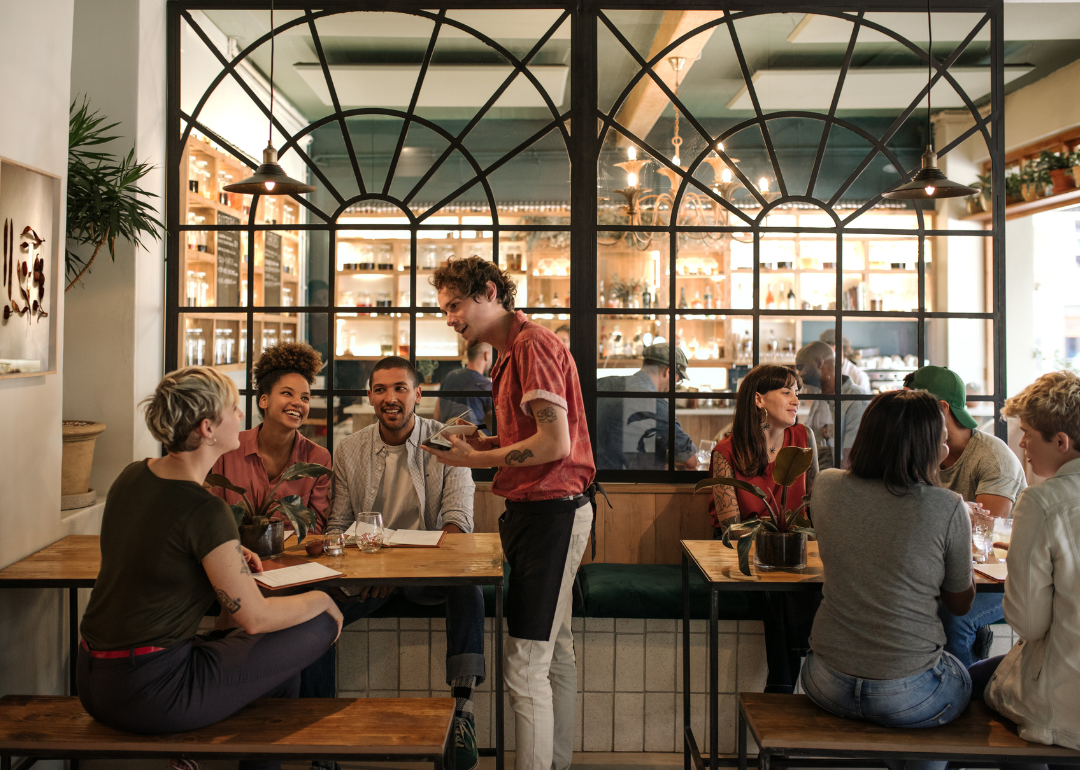
Budgeting for vacation: Flights, shopping, and accommodations will cost you the most
Budgeting for vacation: Flights, shopping, and accommodations will cost you the most
The travel and tourism industry came to a near halt when the COVID-19 pandemic grounded flights, triggered inflation, and put the world under house arrest.
But as vaccines and health protocols became more available, travelers eager to cure their cabin fever spent more than $1 trillion in 2021—a 64% increase from the previous year—on travel goods and services, according to data from the Bureau of Economic Analysis' annual U.S. Travel and Tourism Satellite Account.
While the spike in spending is still below pre-pandemic levels, it's clear the travel and tourism industry is on the mend when you follow the money.
Stacker used the bureau's data to rank how much tourists spent on lodging, airfare, souvenirs, and other travel-related items in 2021, the latest data available. The bureau measures total spending on goods and services made in the United States and purchased by travelers.
Unsurprisingly, air travel and accommodations top the 19-item list of total travel spending. Shopping and food and beverage services recorded the most significant increases in spending as Americans saw record levels of disposable income.
Because of America's unprecedented inflation—2022 saw a record 40-year increase—Stacker's ranking looked at the data as a percentage of overall cost rather than the actual money spent. Goods and services on the list are ranked by the share of total tourist spending and rounded to the nearest one-tenth of 1%.
The data show the total spending of nonresidents and domestic travelers in the U.S.
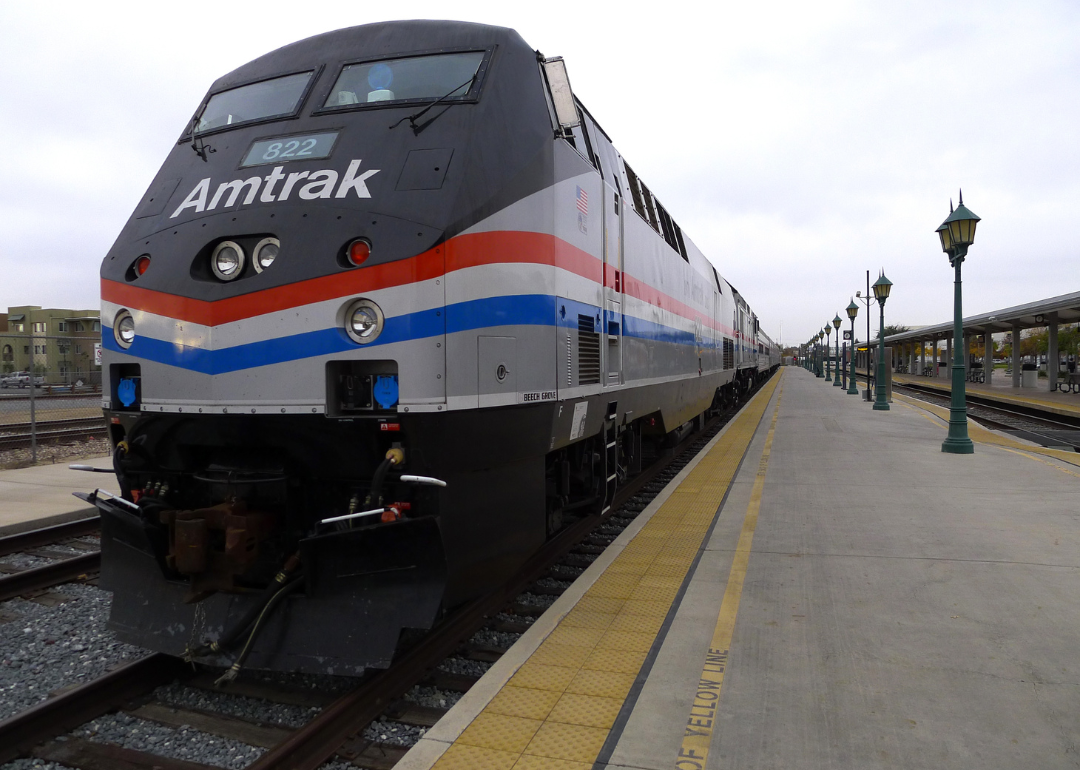
#19. Train travel
- Share of total travel spending: 0.1%
- Total spent in 2021: $1.0B
- Change from the year before: +55.1%
In July 2021, Amtrak's ridership reached 1.8 million people. In February 2021, a 62-mile train ride cost passengers an average of $60, according to Fleet Logging, an electronic logging device industry website.
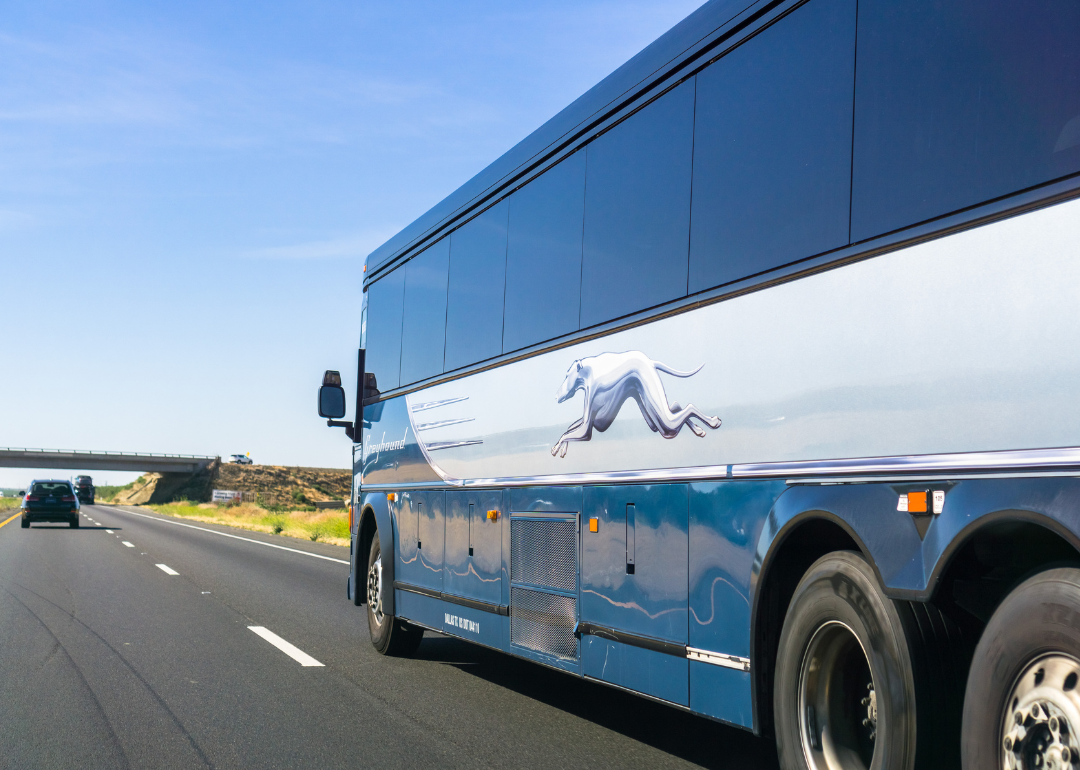
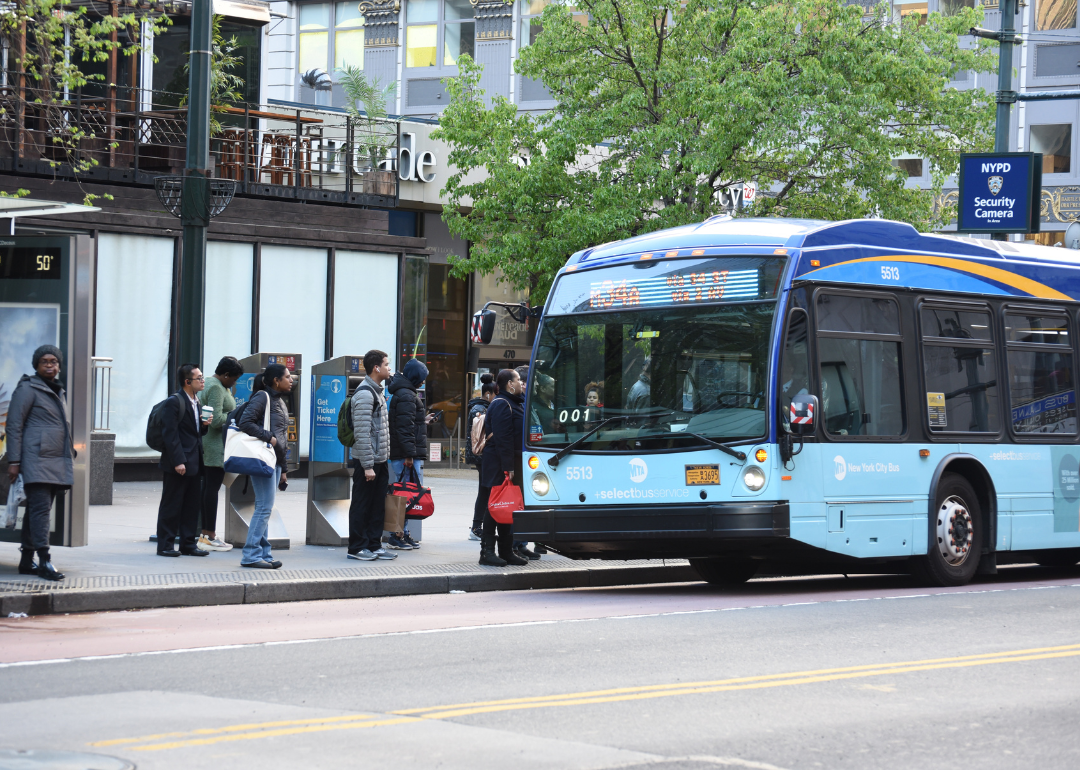
#18. Bus travel
- Share of total travel spending: 0.1%
- Total spent in 2021: $1.2B
- Change from the year before: +5.8%
In 2021, an average of 10,000 passengers rode Greyhound daily—one-fourth of its pre-pandemic ridership. For a 60-mile trip, U.S. bus travelers spent just under $50—$47.94, according to the Fleet Logging study.
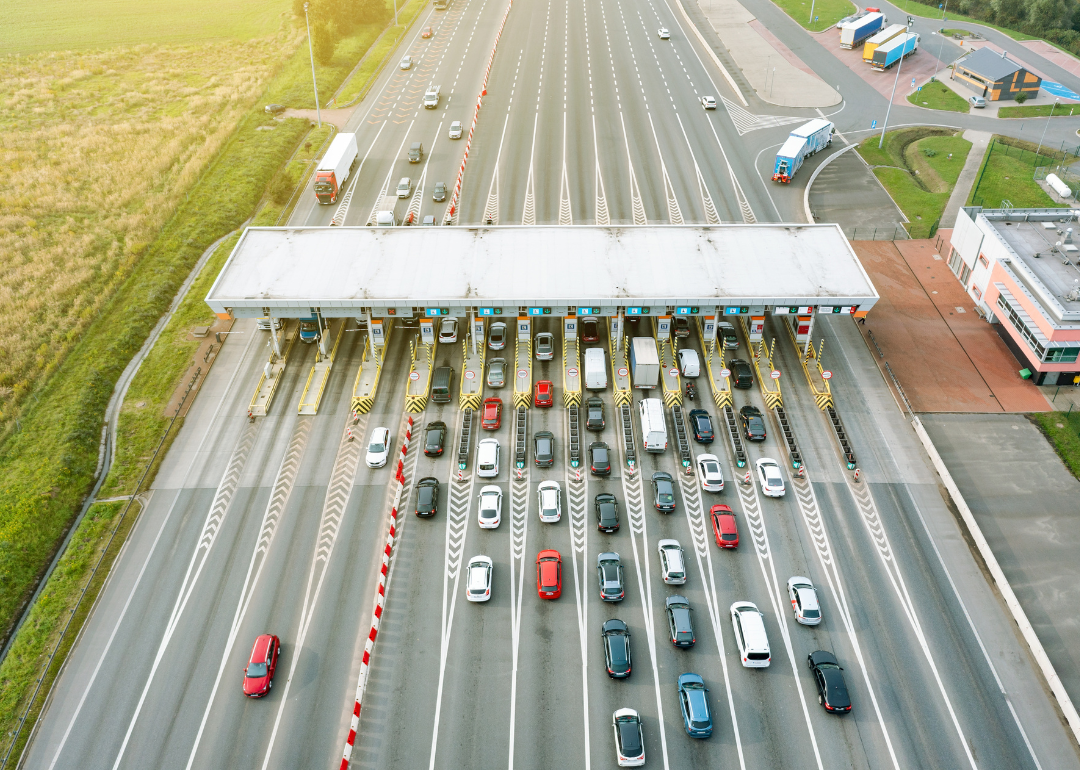
#17. Highway tolls
- Share of total travel spending: 0.2%
- Total spent in 2021: $1.7B
- Change from the year before: +116.1%
U.S. travelers spend about 6 cents per mile traveling interstate toll roads. Non-interstate toll roads cost an additional 7 cents per mile, according to Uproad, an electronic road payment system. Partially due to leisure travel, the Department of Transportation reported driving in the U.S. increased to 3.23 trillion vehicle miles in 2021, an increase from 2.9 trillion in 2020.
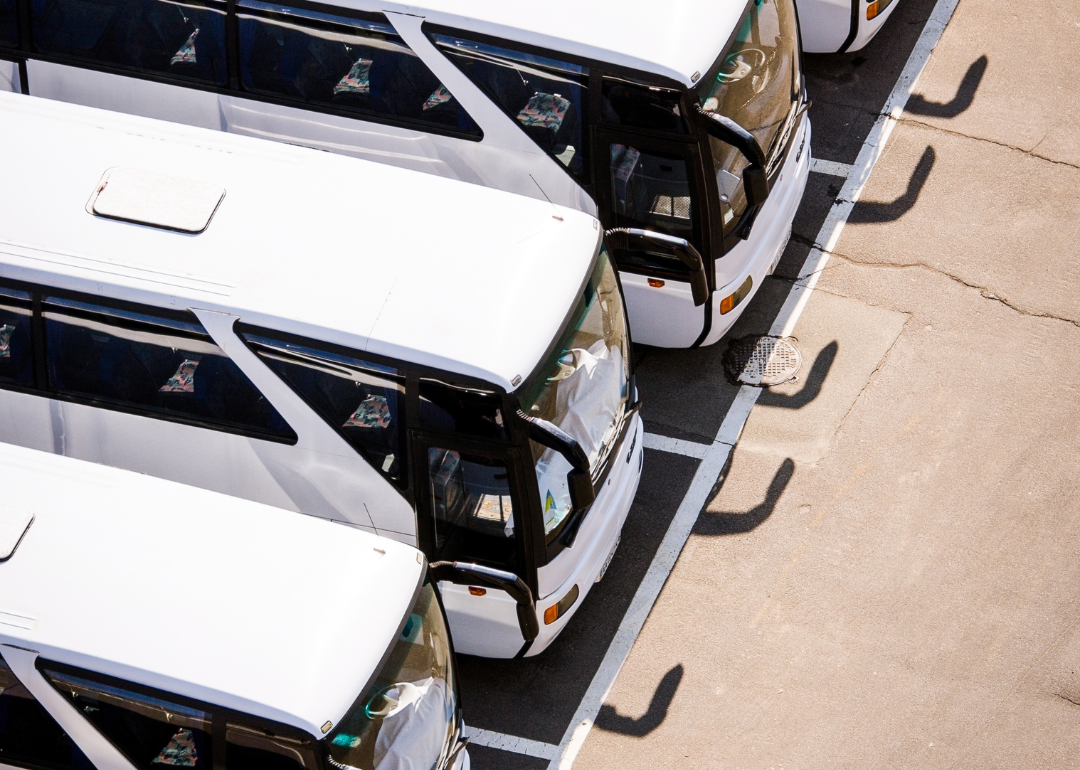
#16. Charter buses
- Share of total travel spending: 0.2%
- Total spent in 2021: $2.3B
- Change from the year before: +40.3%
A driver shortage created a need for more competitive wages, and coupled with America's elevated gas prices, resulting in higher charter bus prices. Costs to charter a bus depend on the bus' mileage, type, and how long travelers need the bus. Prices range from $300 to $2,500 per day, according to Howmuchisit.org.
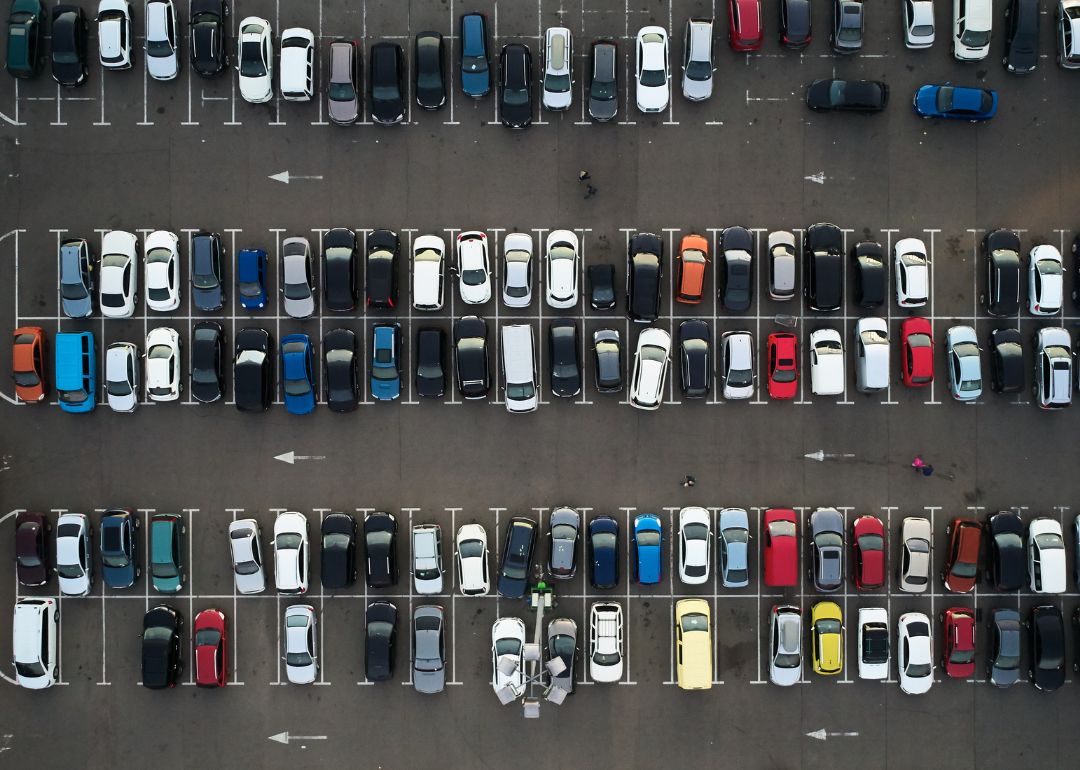
#15. Parking
- Share of total travel spending: 0.3%
- Total spent in 2021: $2.9B
- Change from the year before: +113.4%
Travelers spend an average of $18 per day on airport parking, according to data examined by Bankrate. "U.S. airlines carried 674 million passengers (not seasonally adjusted) in 2021, 82.5% more than in 2020 (369 million)," the Bureau of Transportation Statistics reported.
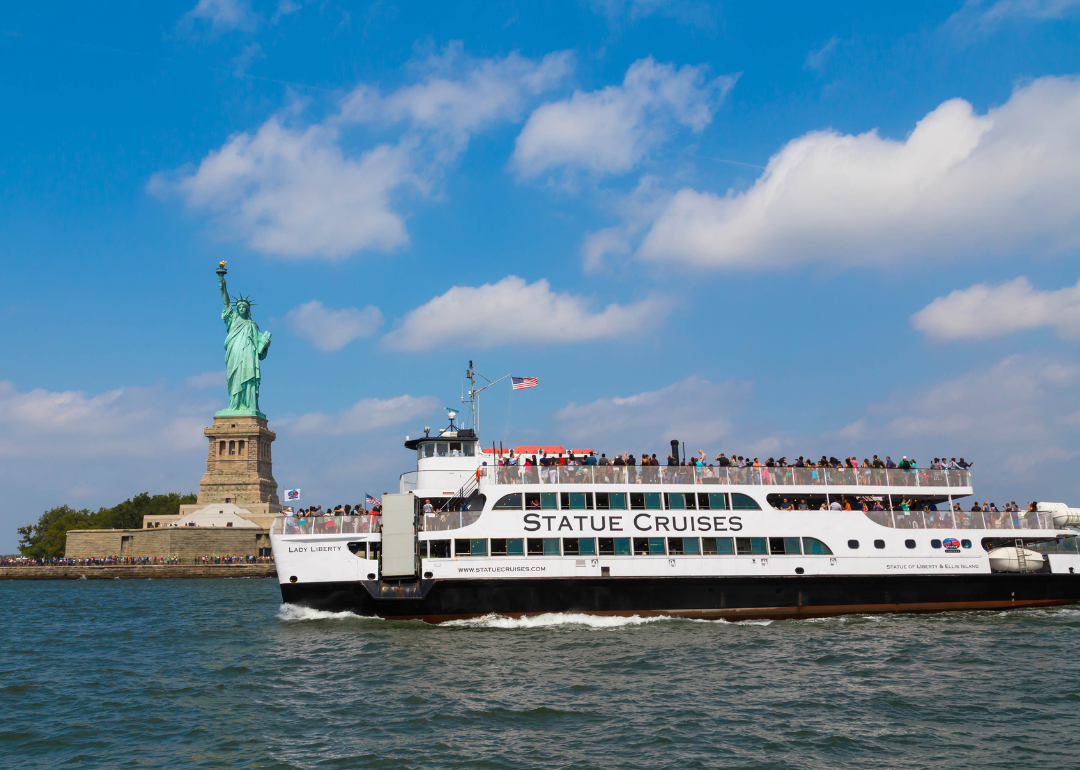
#14. Sightseeing tours
- Share of total travel spending: 0.3%
- Total spent in 2021: $3.1B
- Change from the year before: +83.8%
Tourists in America spend an average of just under $400 per day on sightseeing tours, according to a study based on data from 899 tours from Budget Your Trip. Top domestic destinations include the French Quarter in New Orleans, the Willis Tower in Chicago, and the Statue of Liberty in New York.
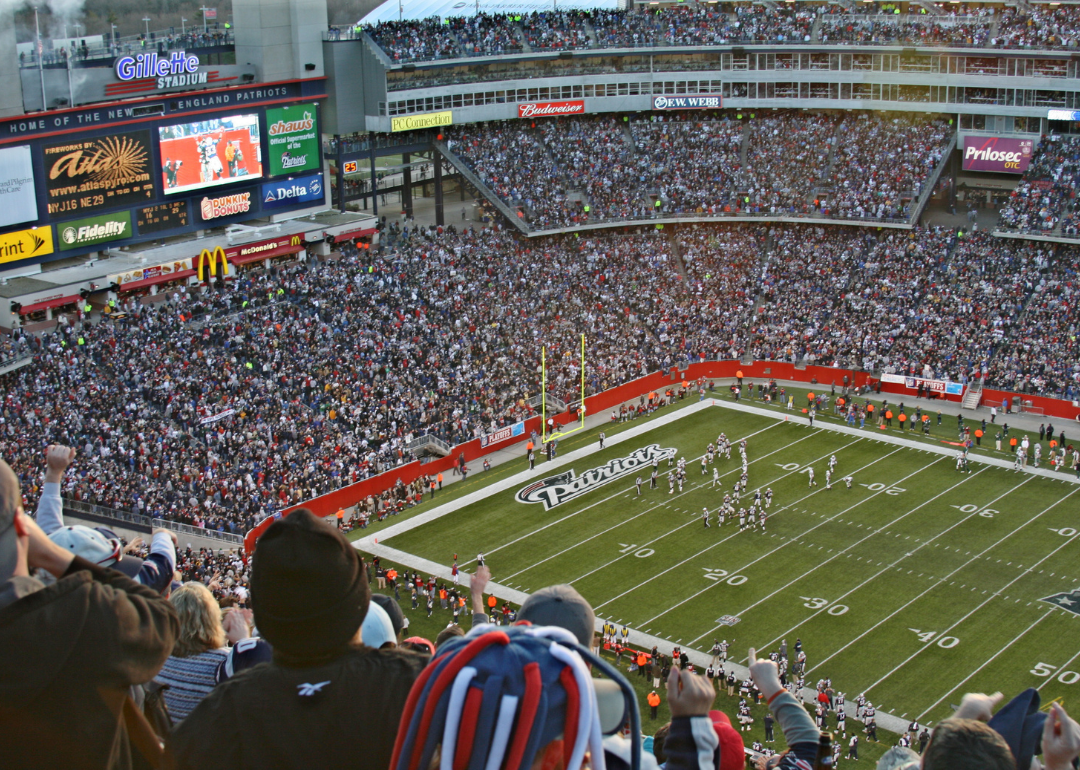
#13. Sporting events
- Share of total travel spending: 0.4%
- Total spent in 2021: $4.1B
- Change from the year before: +44.9%
Considered in the industry as the "blueprint" for post-pandemic recovery, more than 175 million people traveled in the U.S. for sport-related reasons in 2021, according to a study by the Sports Events & Tourism Association. The association said that the sports tourism industry's 2021 engagement levels were only 2.6% below 2019's pre-pandemic numbers.
According to the ticket-selling website Seat Geek, the average price for Major League Soccer and Major League Baseball games is about $50; the National Basketball Association and National Hockey League average $90 for tickets. The National Football League has the most expensive average at $151 per ticket.
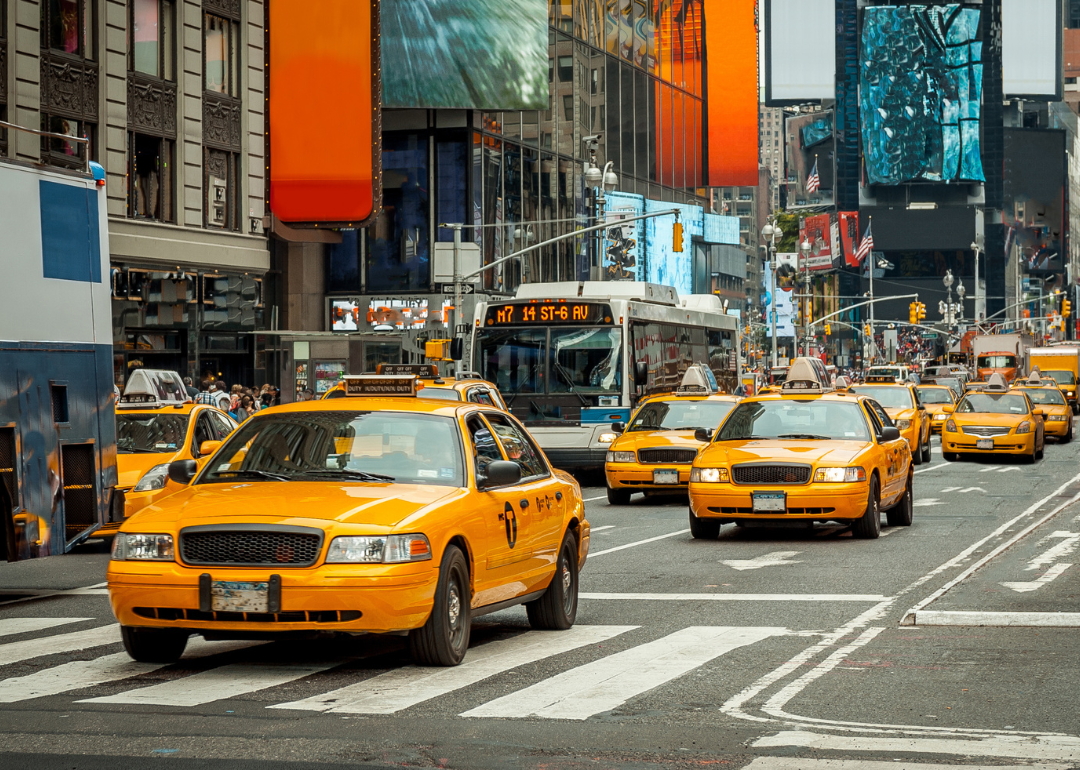
#12. Taxis
- Share of total travel spending: 0.4%
- Total spent in 2021: $4.3B
- Change from the year before: +70.0%
On out-of-town trips, vacationing families spend about $119 on taxis and car service rides per year, according to an analysis of U.S. consumer spending data by financial website ValuePenguin. In 2021, New York's iconic yellow taxis made approximately 31 million trips, according to data from the city's Taxi and Limousine Commission.
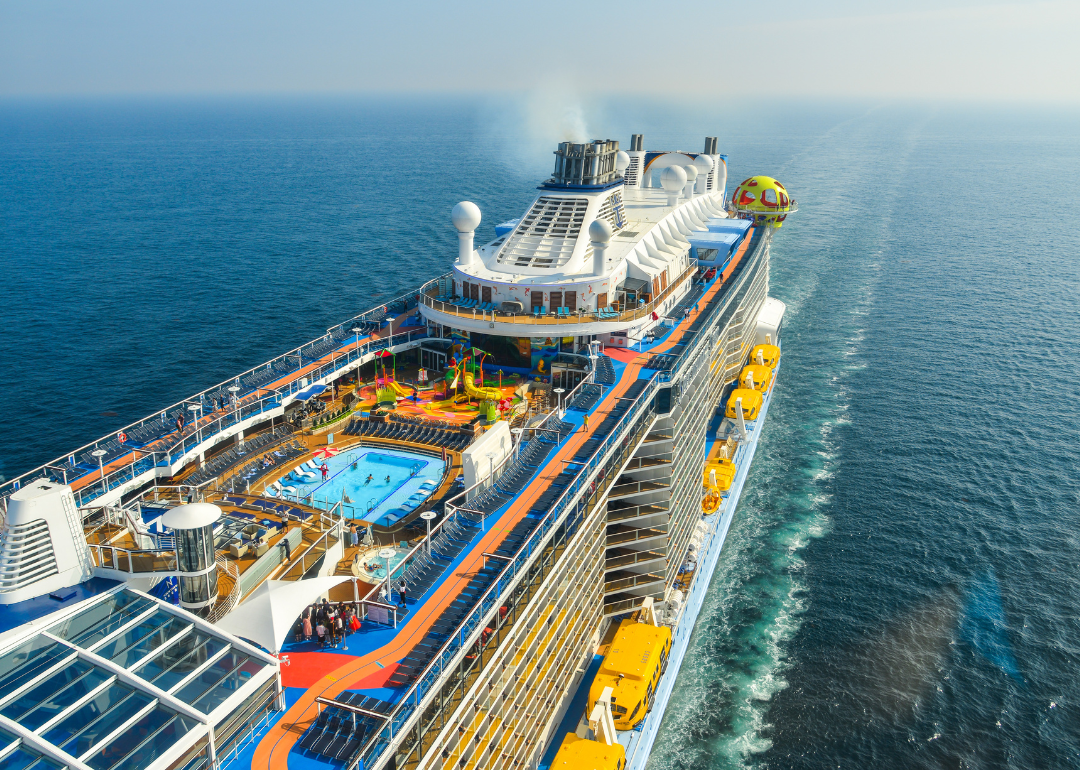
#11. Water transit
- Share of total travel spending: 0.6%
- Total spent in 2021: $6.1B
- Change from the year before: -19.7%
The water transit tourism industry includes cruises, jet skis, sailboats, yachts, ferries, canoes, and rafts. The average daily cost for a Royal Caribbean or Carnival cruise is between $90 to $100 per person, according to Cruzely, a trade website. Norwegian Cruise Line averages about $130 daily per person.
More than 14 million Americans took a cruise vacation in 2019, but the number of domestic cruise passengers dropped to a little more than 2 million two years later, according to Statista.
#10. Local buses
- Share of total travel spending: 0.9%
- Total spent in 2021: $9.1B
- Change from the year before: +228.1%
Buses are the most used mode of public transportation in the U.S., which explains why tourists would use them when vacationing. Buses account for almost half of public transit trips, according to Statista. Local bus fares range from free to just under $3.
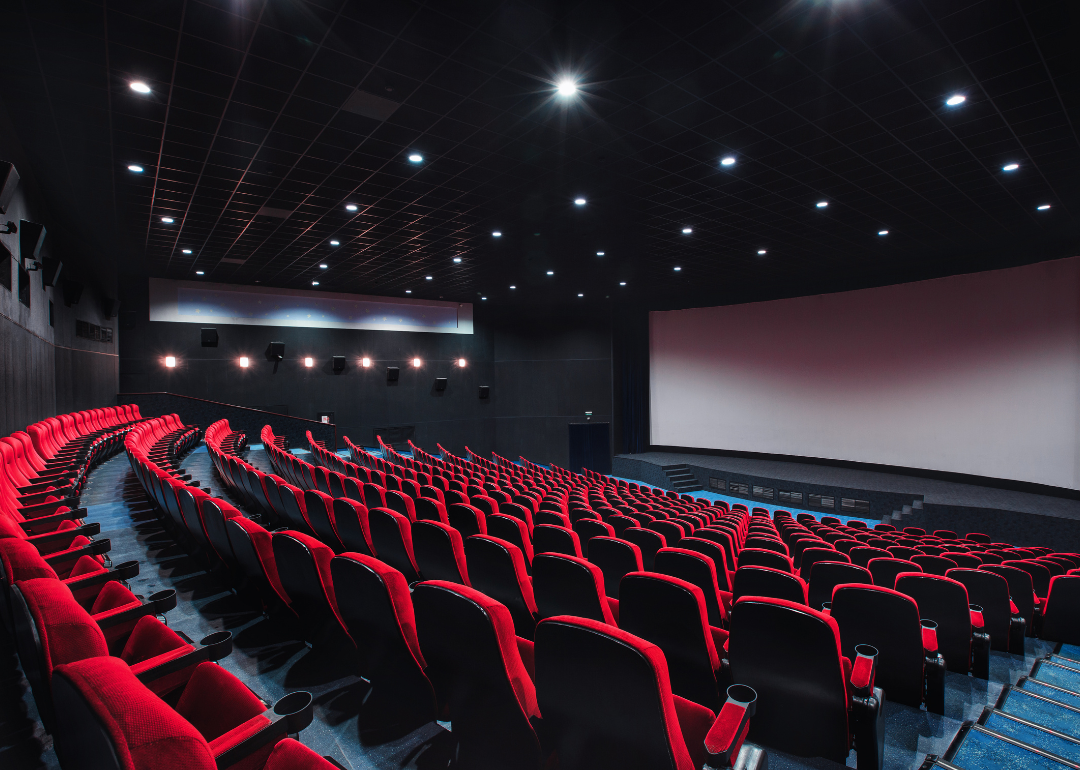
#9. Movies and performing art shows
- Share of total travel spending: 1.5%
- Total spent in 2021: $15.5B
- Change from the year before: +14.7%
Moviegoers spend an average of $10.45 on tickets. In 2021, domestic ticket sales exceeded 434 million, according to data from The Numbers, a reference library that studies the movie industry. An analysis by the National Endowment for the Arts found performing-arts venue ticket sales recovering in 2021 after the pandemic shut them down, but not reaching pre-pandemic levels.

#8. Gambling
- Share of total travel spending: 2.3%
- Total spent in 2021: $24.3B
- Change from the year before: +40.2%
Americans gamble an average of $682 per year, according to PlayUSA, a casino industry website. Two-thirds of Americans have traveled to a different state to gamble at a casino—gamblers travel about 335 miles to casinos.
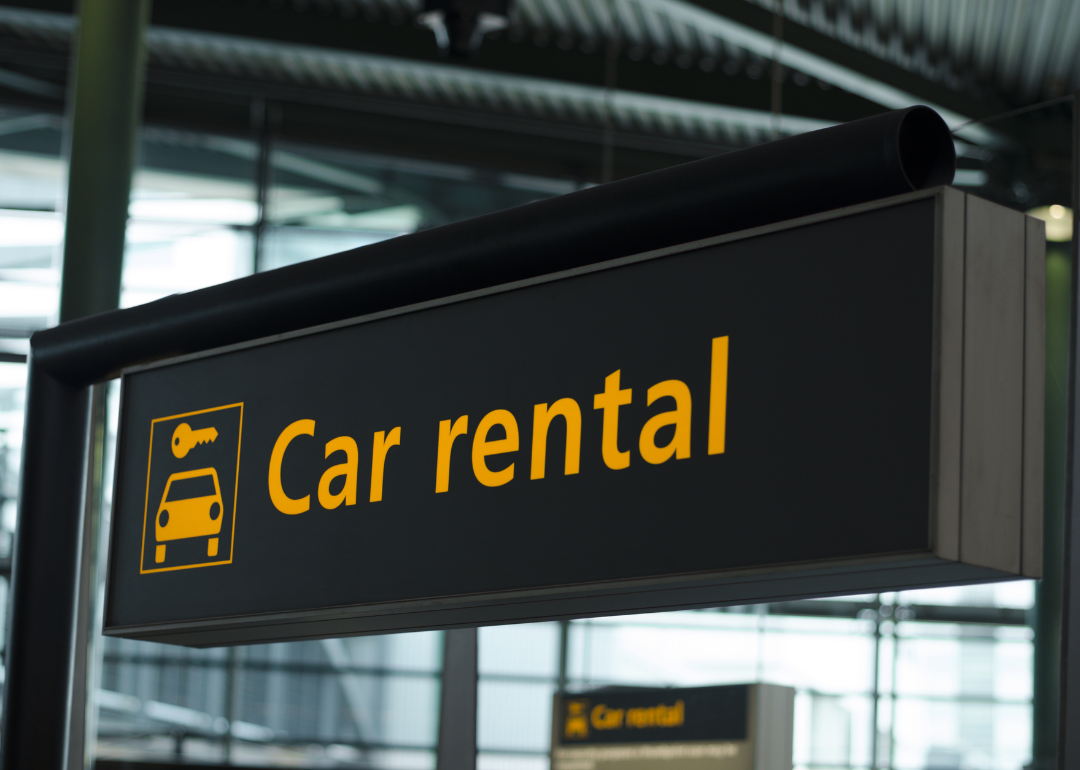
#7. Car rentals
- Share of total travel spending: 4.2%
- Total spent in 2021: $44.1B
- Change from the year before: +20.4%
In 2021 customers rented 29.2 million cars, almost double the amount of the previous year, according to statistics website Zippia. During the pandemic, many rental car companies sold off their fleets, causing prices to increase. Zippia's data showed the average rental price for cars and trucks went from $123.18 in December 2017 to $193.75 in December 2021, with the average daily price for a car rental at $81 in December 2021.

#6. Travel agents
- Share of total travel spending: 6.9%
- Total spent in 2021: $73.7B
- Change from the year before: +93.1%
The national average fixed price for a travel agent is around $50 per person, according to Howmuchisit.org, a data-compilation website. The American Society of Travel Advisors reported that people booked 29% of all travel through travel agencies in 2021, which made it the most significant channel for sales.
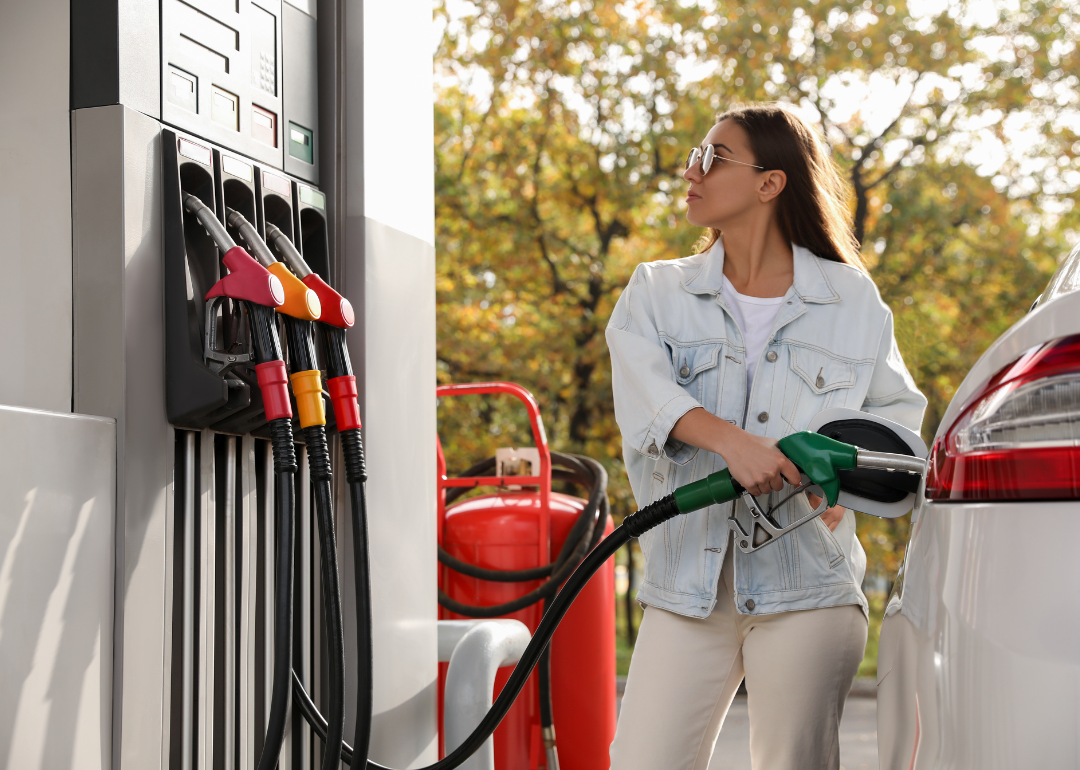
#5. Gas
- Share of total travel spending: 12.2%
- Total spent in 2021: $129.8B
- Change from the year before: +49.1%
Tourists in America spent an average of $669 on gas for out-of-town trips, according to ValuePenguin data. The U.S. average cost for gas in 2021 ranged from $2.25 to $3.41 per gallon, according to the Energy Information Administration.
#4. Food and drinks
- Share of total travel spending: 14.6%
- Total spent in 2021: $155.5B
- Change from the year before: +110.4%
Tourists in America spend $46 per person on food each day when on vacation, according to data examined by personal finance site Bankrate.com. A ValuePenguin study estimates 80% of dining dollars spent during vacations is used in restaurants.

#3. Shopping
- Share of total travel spending: 15.1%
- Total spent in 2021: $160.2B
- Change from the year before: +128.6%
Shopping tourism attracts overseas visitors to the U.S. Fifty-four percent of international visitors to the U.S. rank shopping as one of their top five activities to do, according to the Tourism Academy, a career-development organization. International tourists spent about $206.91 shopping in the U.S. in 2021, according to the website Global Data.

#2. Accommodations
- Share of total travel spending: 18.0%
- Total spent in 2021: $191.2B
- Change from the year before: +31.9%
The average hotel room sets tourists back $156.43 per night. Airbnb averages $168; hotels from $10 to $40, and RV costs from $30 to $50, according to data compiled by Bankrate.com in 2022.
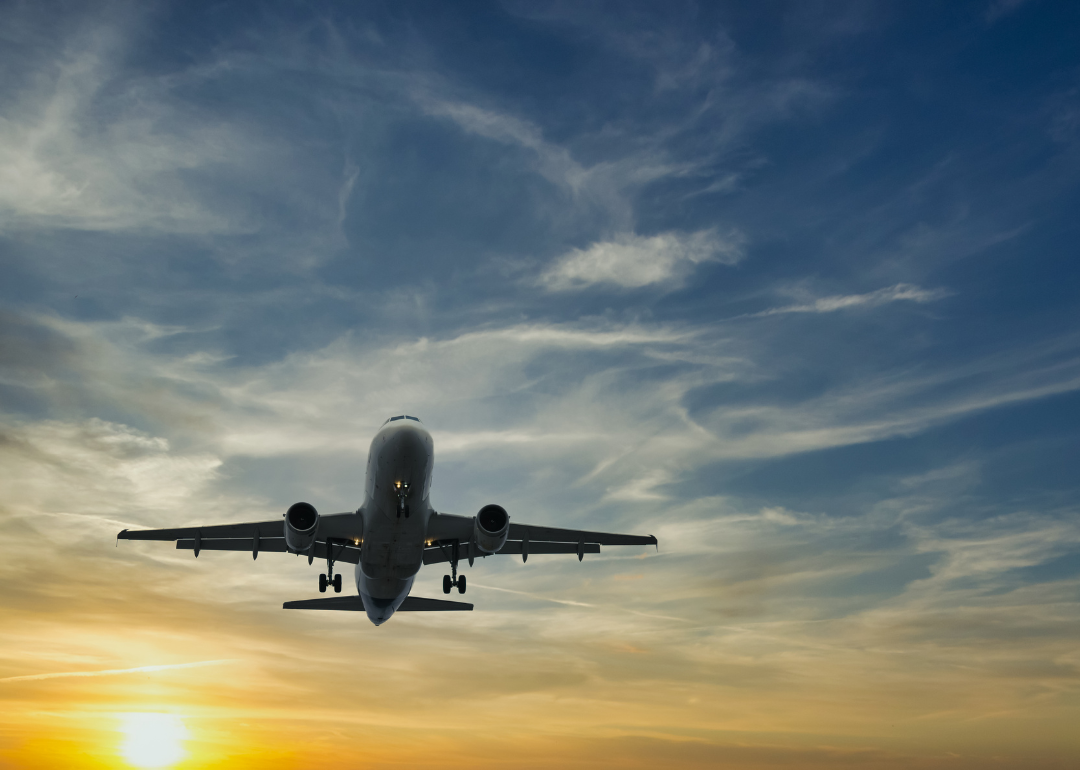
#1. Air travel
- Share of total travel spending: 18.4%
- Total spent in 2021: $195.1B
- Change from the year before: +64.8%
The average cost of a domestic flight in 2021 was $253.75, according to Hopper's Price Tracker, a $3.50 increase from the previous year. Some 674 million passengers hopped a flight on U.S. airlines in 2021, an 82.5% increase from the previous year, according to the Bureau of Transportation Statistics. Despite the increase in travelers, it didn't reach the pre-pandemic number of 927 million passengers.
Fun fact: The airport with the most expensive airfare in 2022 is the Washington D.C., region's Dulles International Airport, with the average flight costing $494.78.
Story editing by Jeff Inglis. Copy editing by Kristen Wegrzyn. Photo selection by Abigail Renaud.