Over $200 billion from the infrastructure law has been spent. Here's what's left.
This story originally appeared on The General and was produced and distributed in partnership with Stacker Studio.
Over $200 billion from the infrastructure law has been spent. Here's what's left.
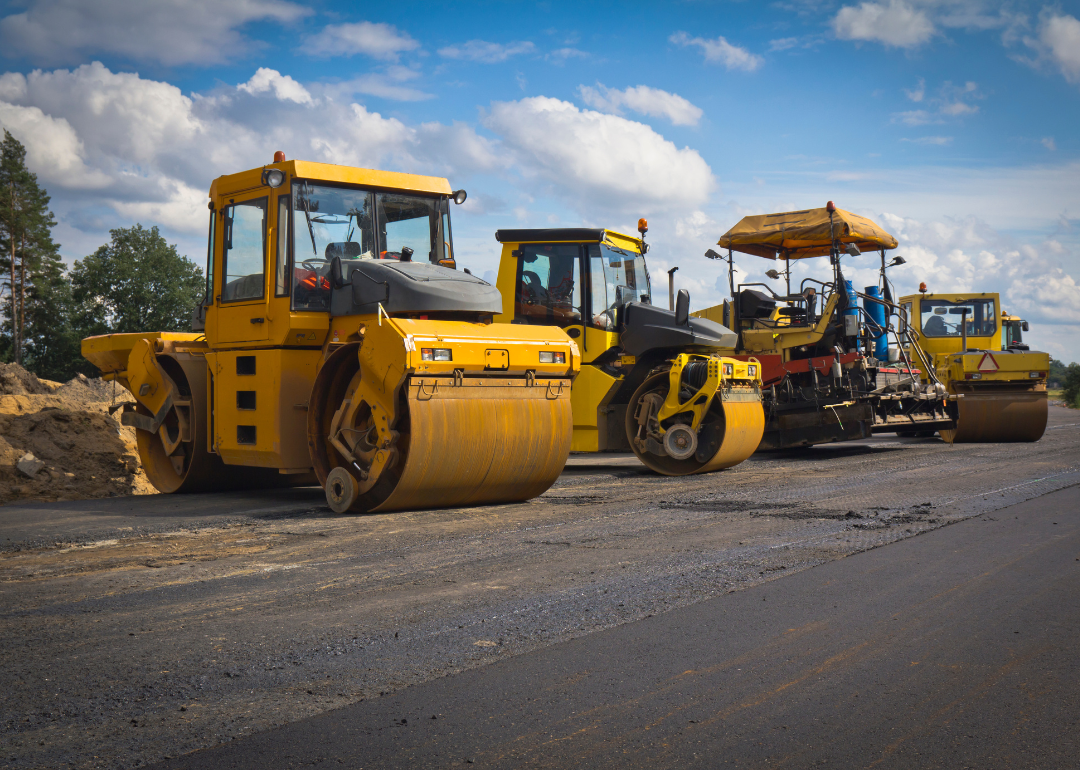
In November 2021, President Biden signed the Infrastructure Investment and Jobs Act, also known as the Bipartisan Infrastructure Law. The IIJA's aim is simple, but sweeping: to use nearly $1 trillion to update the country's roads, bridges, railways, and broadband internet. These improvements are sorely needed. In 2021, the U.S. experienced a water main break every two minutes and nearly half of all public roads in the country were in "poor or mediocre condition," according to the American Society of Civil Engineers.
In the nearly two years since the act went into law, more than 32,000 projects have been funded nationwide through the IIJA. Notable highlights include upgrades to San Francisco's Golden Gate Bridge; funding the construction of the Hudson Tunnel, which connects New Jersey to New York City; and funding for the deployment of high-speed internet to remote tribal communities. Projects both large and small have benefitted every U.S. state.
The General used federal funding data from the White House on the Infrastructure Investment and Jobs Act and data on announced and awarded funding projects to rank states by the percentage of their initial funding amounts still available as of April 20, 2023. Per the White House report, $428 billion was directly allocated to states based on a variety of factors including a general formula for road miles and bridges in "poor" condition.
Announced funding, which is captured from agency press releases, is preliminary and nonbinding and therefore may be contingent on grantees meeting certain requirements. Awarded funding, on the other hand, has been downloaded from USAspending.gov and represents actual obligations, which are defined as legally binding agreements that will result in outlays, either immediately or in the future.
Unlike announced funding, which provides the maximum amount a grantee may receive (subject to meeting certain requirements as noted above), awarded funding represents the sum of all obligations under that award as of the data date of the USAspending report, which is current as of March 31, 2023, and does not necessarily represent the final award amount.
However, states running low on funds need not panic. Additional funding is available for states or localities on an application basis; Montana has spent or allocated more than its original disbursement amount, for example.
Read on to find out how much your state has spent on infrastructure over the past two years, and what industries have been or will be improved the most.

#51. Montana
- Percentage of allotment remaining: 0%
- Total funding from the IIJA: $3.9 billion ($4,105 per capita)
- Funding for projects as of April 20, 2023: $4.6 billion
--- Transportation: $1.4 billion
--- Climate, Energy, and the Environment: $3.0 billion
--- Broadband: $148.6 million
--- Other: $761.1 thousand

#50. Wyoming
- Percentage of allotment remaining: 5.2%
- Total funding from the IIJA: $2.6 billion ($4,215 per capita)
- Funding for projects as of April 20, 2023: $2.5 billion
--- Transportation: $848.8 million
--- Climate, Energy, and the Environment: $1.6 billion
--- Broadband: $18.0 million
--- Other: $308.5 thousand

#49. New Mexico
- Percentage of allotment remaining: 19.7%
- Total funding from the IIJA: $3.7 billion ($1,416 per capita)
- Funding for projects as of April 20, 2023: $3.0 billion
--- Transportation: $1.3 billion
--- Climate, Energy, and the Environment: $1.3 billion
--- Broadband: $421.8 million
--- Other: $25.0 thousand
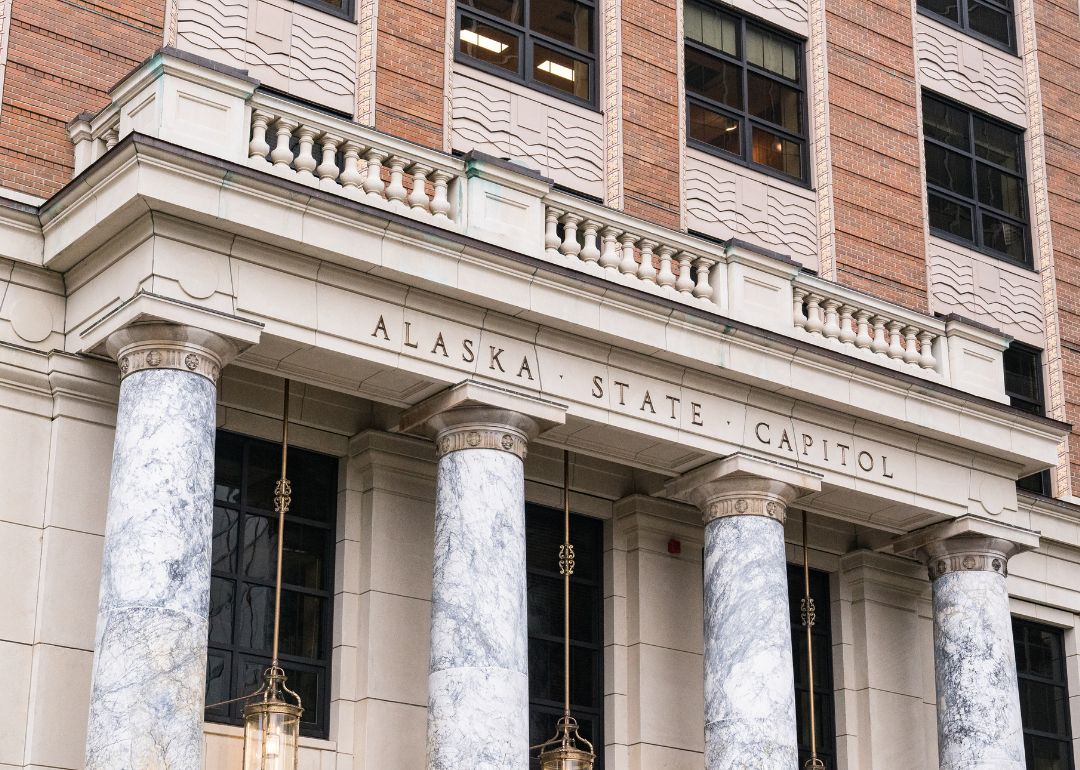
#48. Alaska
- Percentage of allotment remaining: 20.0%
- Total funding from the IIJA: $4.9 billion ($5,377 per capita)
- Funding for projects as of April 20, 2023: $3.9 billion
--- Transportation: $2.5 billion
--- Climate, Energy, and the Environment: $970.3 million
--- Broadband: $407.5 million
--- Other: $59.6 million
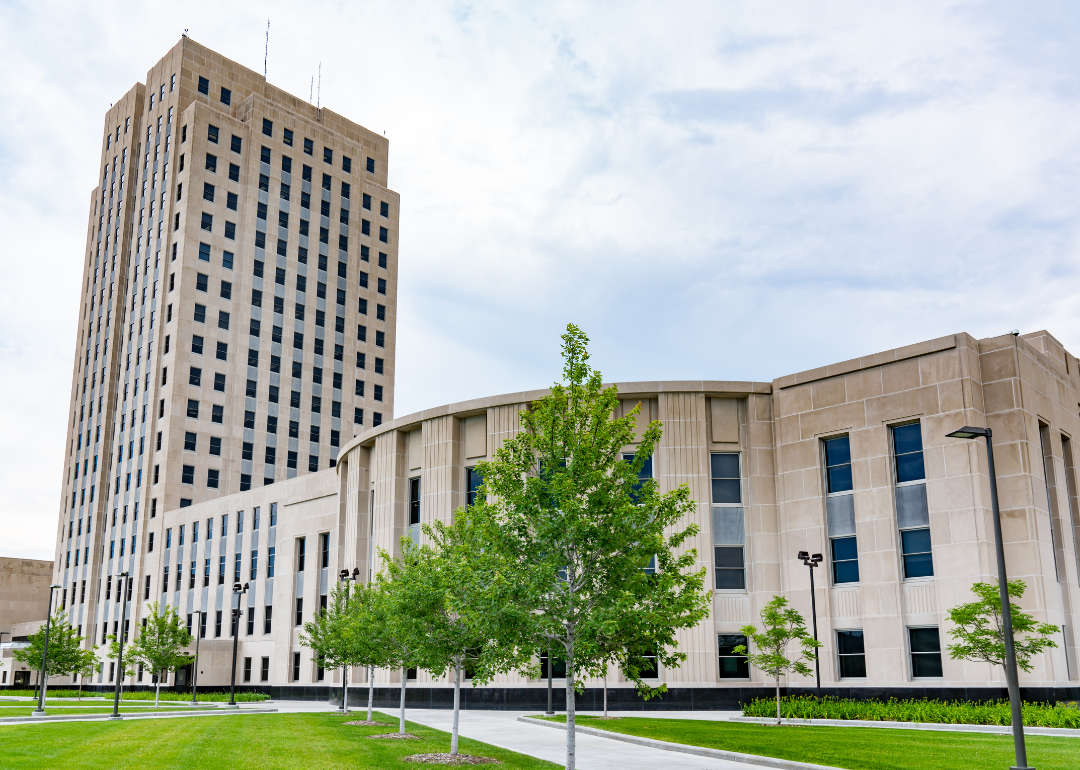
#47. North Dakota
- Percentage of allotment remaining: 26.0%
- Total funding from the IIJA: $2.6 billion ($2,507 per capita)
- Funding for projects as of April 20, 2023: $2.0 billion
--- Transportation: $883.6 million
--- Climate, Energy, and the Environment: $1.1 billion
--- Broadband: $14.2 million
--- Other: $592.3 thousand

#46. Kentucky
- Percentage of allotment remaining: 37.3%
- Total funding from the IIJA: $6.5 billion ($901 per capita)
- Funding for projects as of April 20, 2023: $4.1 billion
--- Transportation: $2.6 billion
--- Climate, Energy, and the Environment: $1.4 billion
--- Broadband: $64.0 million
--- Other: $3.5 million
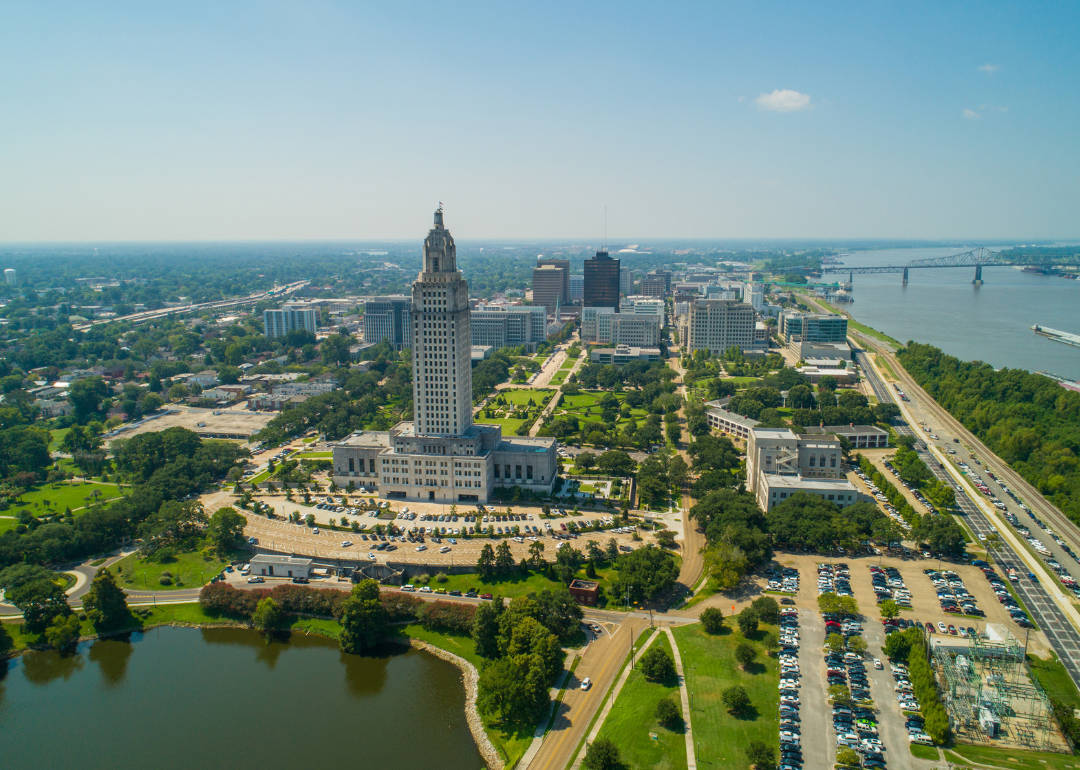
#45. Louisiana
- Percentage of allotment remaining: 37.5%
- Total funding from the IIJA: $7.3 billion ($988 per capita)
- Funding for projects as of April 20, 2023: $4.5 billion
--- Transportation: $3.4 billion
--- Climate, Energy, and the Environment: $1.1 billion
--- Broadband: $2.9 million
--- Other: $6.9 million
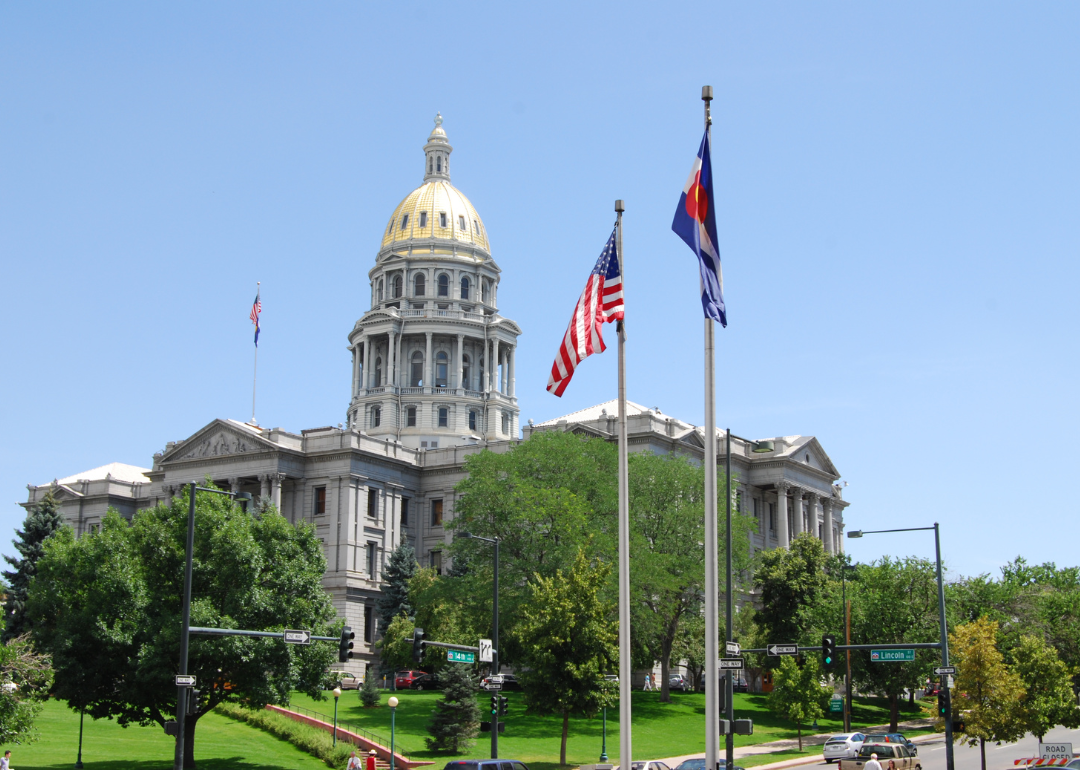
#44. Colorado
- Percentage of allotment remaining: 41.1%
- Total funding from the IIJA: $6.1 billion ($612 per capita)
- Funding for projects as of April 20, 2023: $3.6 billion
--- Transportation: $2.2 billion
--- Climate, Energy, and the Environment: $1.2 billion
--- Broadband: $109.8 million
--- Other: $1.5 million
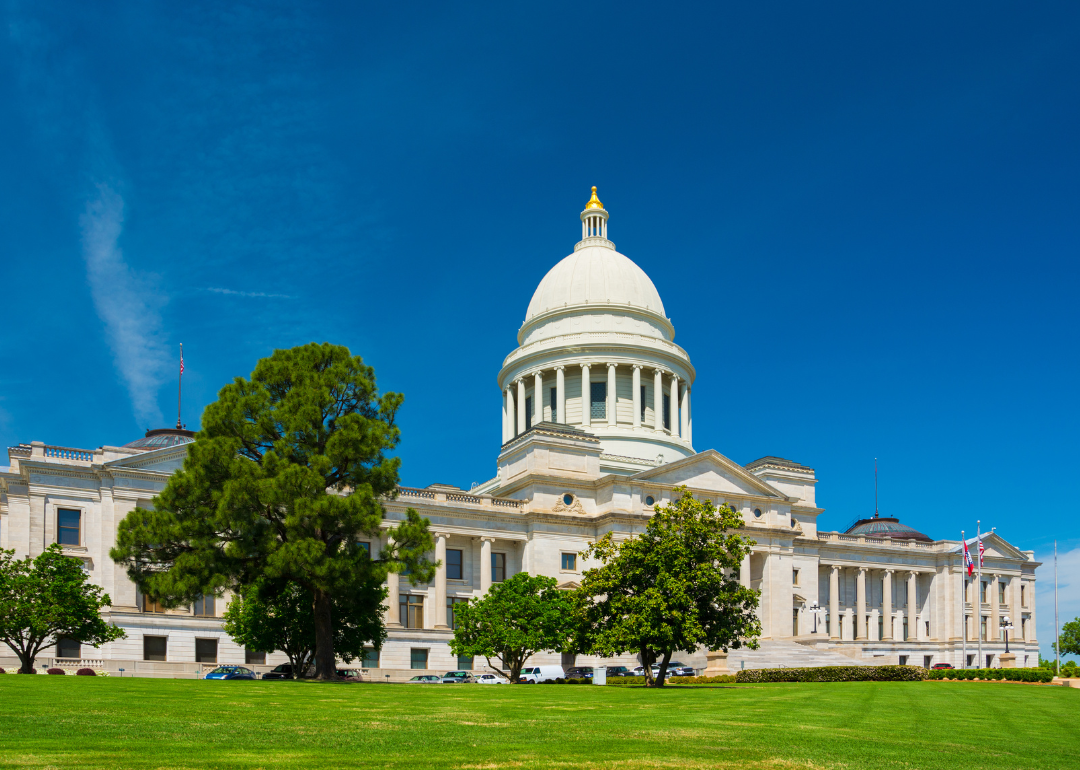
#43. Arkansas
- Percentage of allotment remaining: 41.4%
- Total funding from the IIJA: $5.0 billion ($955 per capita)
- Funding for projects as of April 20, 2023: $2.9 billion
--- Transportation: $2.3 billion
--- Climate, Energy, and the Environment: $560.7 million
--- Broadband: $39.6 million
--- Other: $2.4 million

#42. Utah
- Percentage of allotment remaining: 43.7%
- Total funding from the IIJA: $4.0 billion ($659 per capita)
- Funding for projects as of April 20, 2023: $2.2 billion
--- Transportation: $1.3 billion
--- Climate, Energy, and the Environment: $904.5 million
--- Broadband: $21.5 million
--- Other: $838.5 thousand
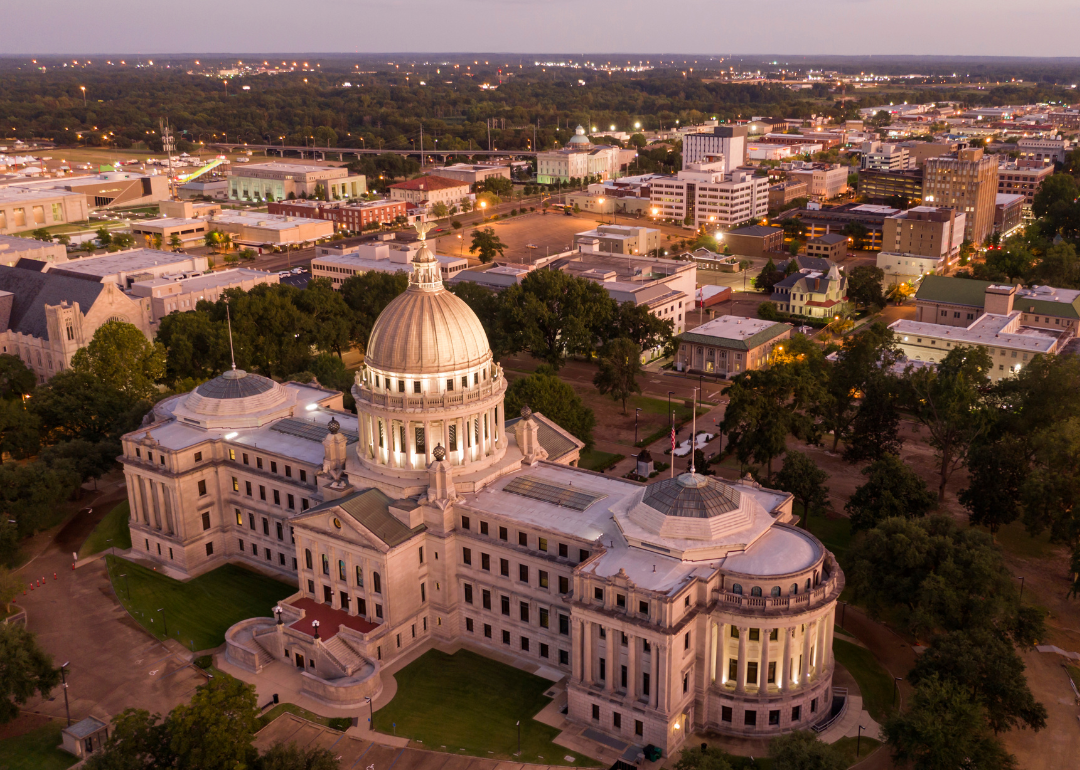
#41. Mississippi
- Percentage of allotment remaining: 44.5%
- Total funding from the IIJA: $4.5 billion ($843 per capita)
- Funding for projects as of April 20, 2023: $2.5 billion
--- Transportation: $1.7 billion
--- Climate, Energy, and the Environment: $751.4 million
--- Broadband: $46.3 million
--- Other: $6.0 million
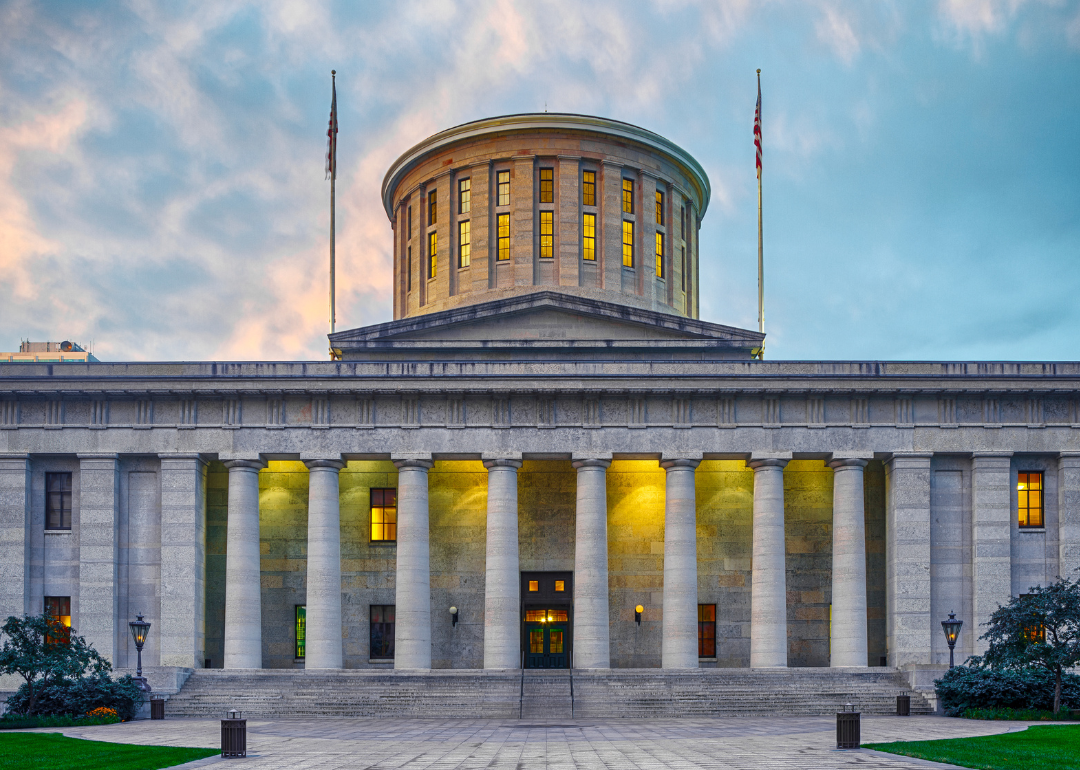
#40. Ohio
- Percentage of allotment remaining: 44.8%
- Total funding from the IIJA: $12.8 billion ($602 per capita)
- Funding for projects as of April 20, 2023: $7.1 billion
--- Transportation: $5.9 billion
--- Climate, Energy, and the Environment: $1.2 billion
--- Broadband: $6.5 million
--- Other: $4.6 million
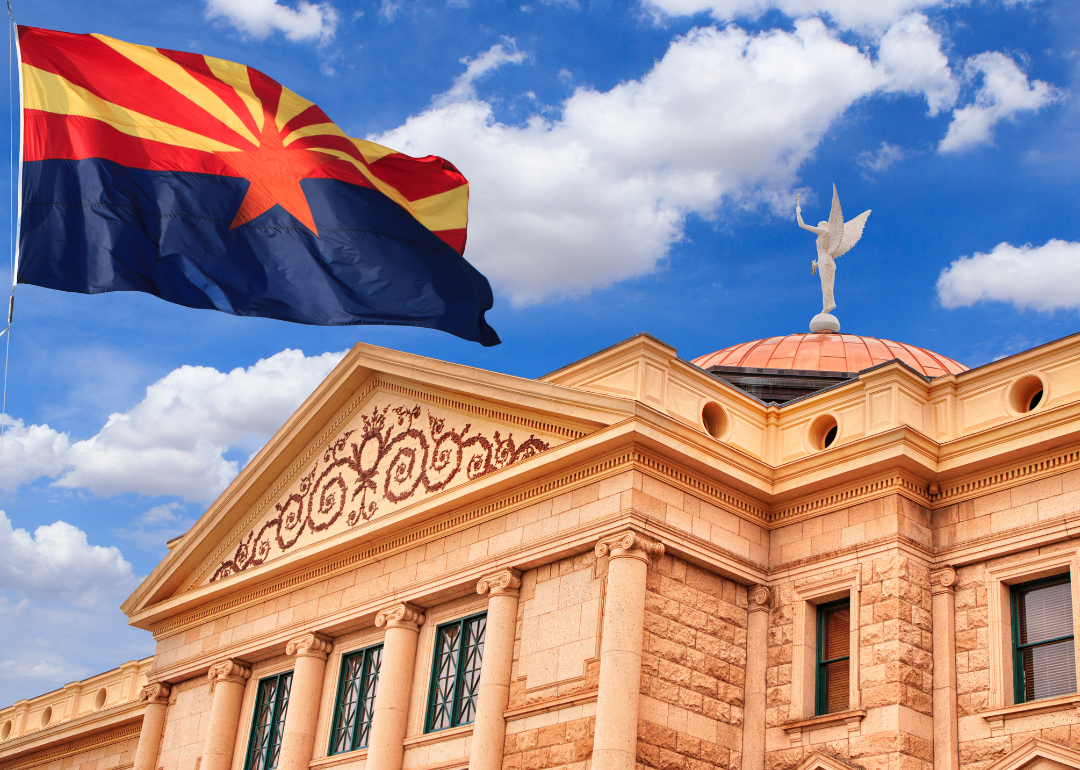
#39. Arizona
- Percentage of allotment remaining: 45.0%
- Total funding from the IIJA: $7.3 billion ($546 per capita)
- Funding for projects as of April 20, 2023: $4.0 billion
--- Transportation: $2.6 billion
--- Climate, Energy, and the Environment: $1.3 billion
--- Broadband: $177.7 million
--- Other: $1.7 million
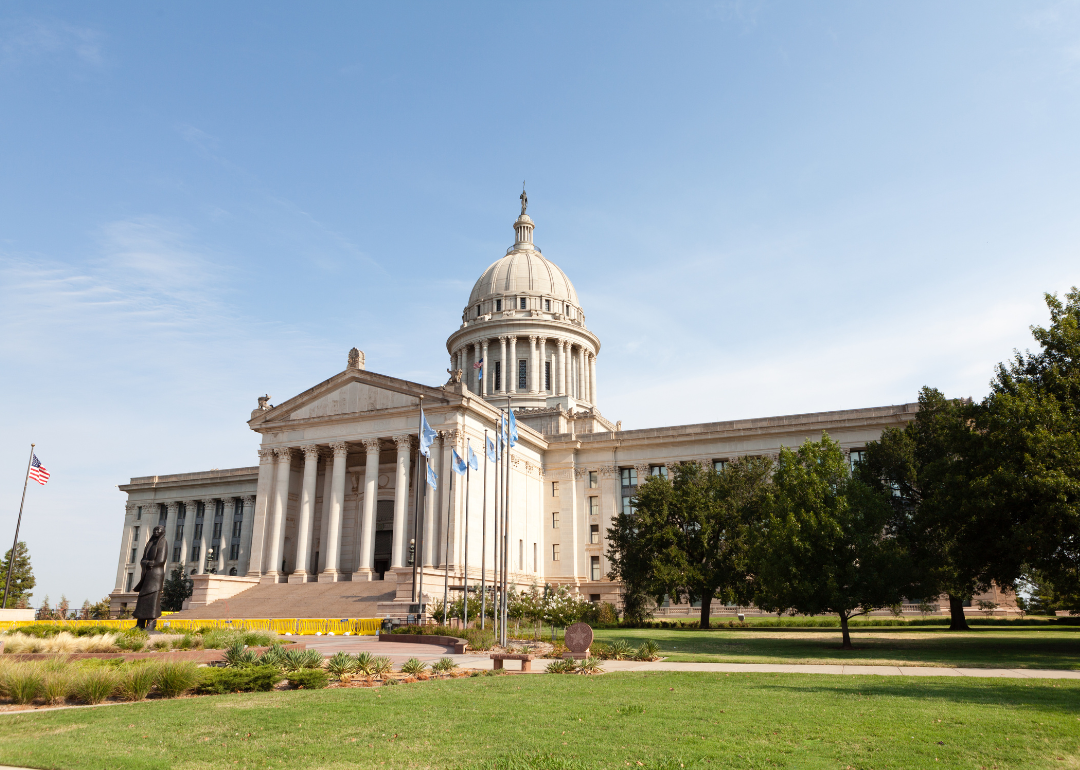
#38. Oklahoma
- Percentage of allotment remaining: 45.5%
- Total funding from the IIJA: $5.8 billion ($782 per capita)
- Funding for projects as of April 20, 2023: $3.1 billion
--- Transportation: $2.3 billion
--- Climate, Energy, and the Environment: $530.7 million
--- Broadband: $322.7 million
--- Other: $1.0 million
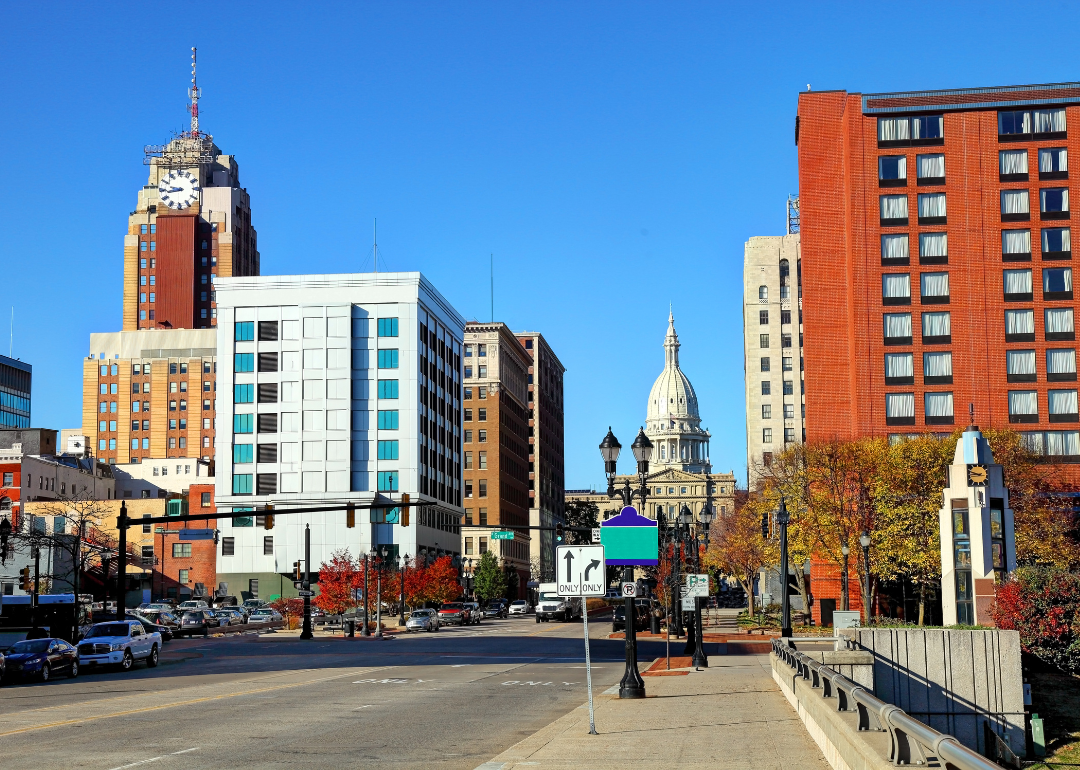
#37. Michigan
- Percentage of allotment remaining: 47.5%
- Total funding from the IIJA: $10.8 billion ($564 per capita)
- Funding for projects as of April 20, 2023: $5.7 billion
--- Transportation: $4.7 billion
--- Climate, Energy, and the Environment: $896.6 million
--- Broadband: $106.1 million
--- Other: $6.5 million
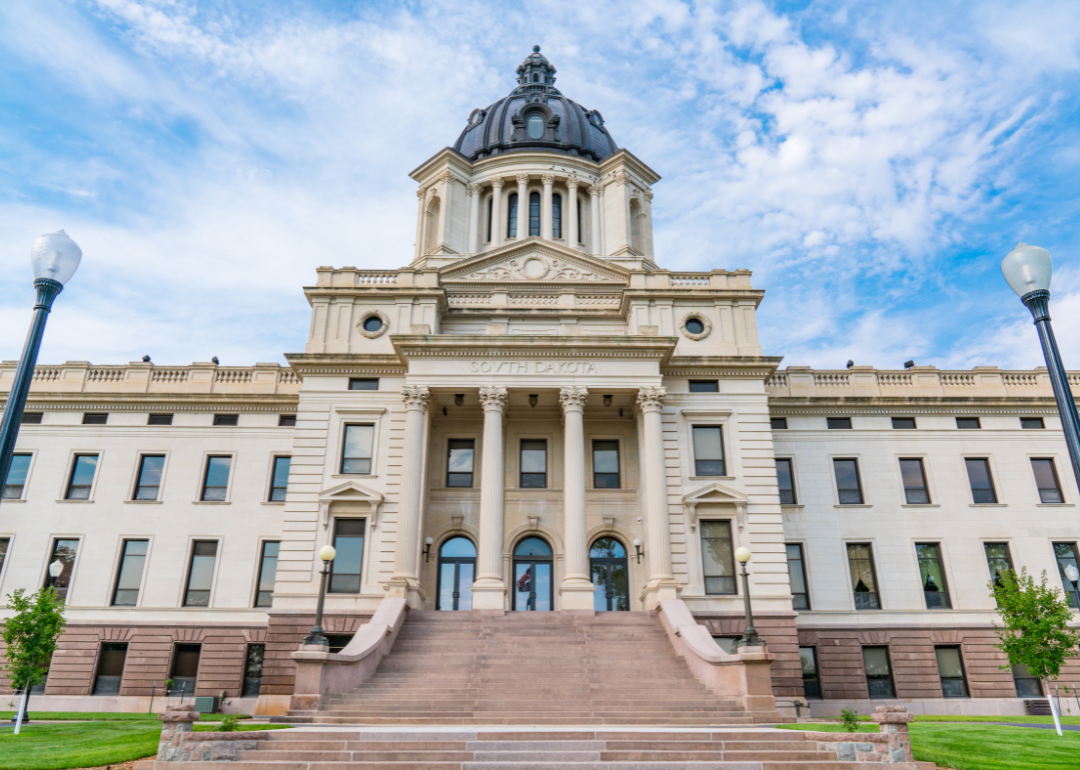
#36. South Dakota
- Percentage of allotment remaining: 49.0%
- Total funding from the IIJA: $2.8 billion ($1,595 per capita)
- Funding for projects as of April 20, 2023: $1.5 billion
--- Transportation: $979.5 million
--- Climate, Energy, and the Environment: $380.7 million
--- Broadband: $90.7 million
--- Other: $537.1 thousand
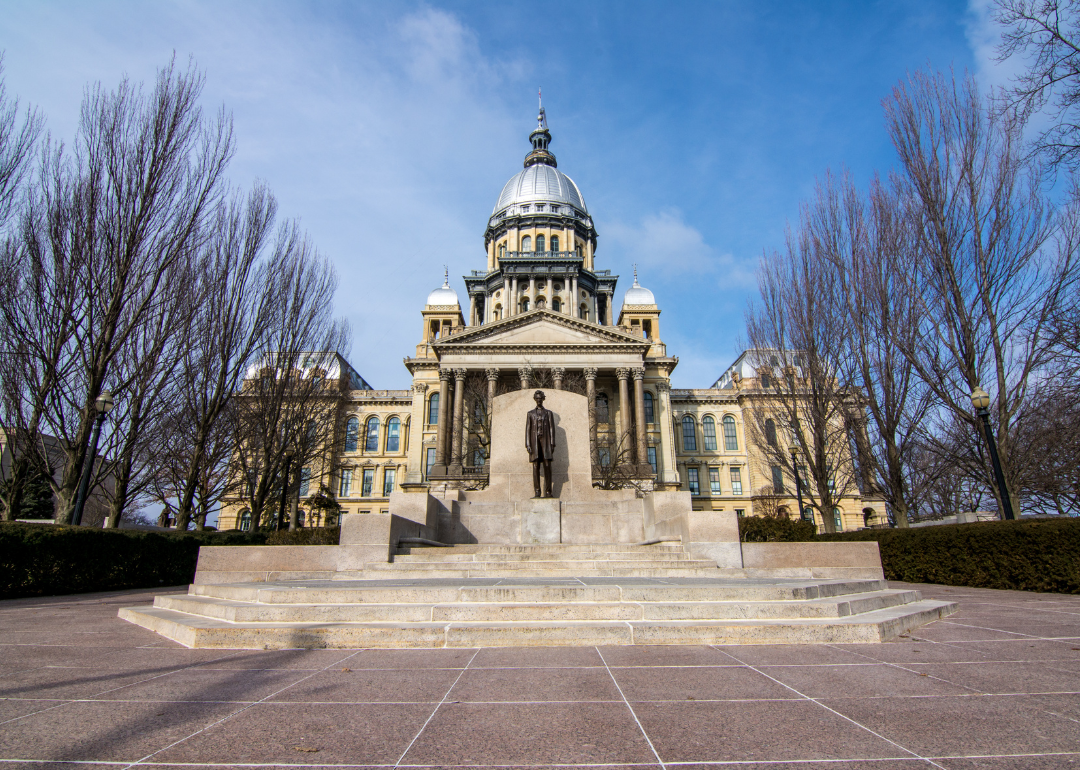
#35. Illinois
- Percentage of allotment remaining: 49.3%
- Total funding from the IIJA: $17.8 billion ($718 per capita)
- Funding for projects as of April 20, 2023: $9.0 billion
--- Transportation: $6.5 billion
--- Climate, Energy, and the Environment: $2.4 billion
--- Broadband: $121.5 million
--- Other: $7.8 million
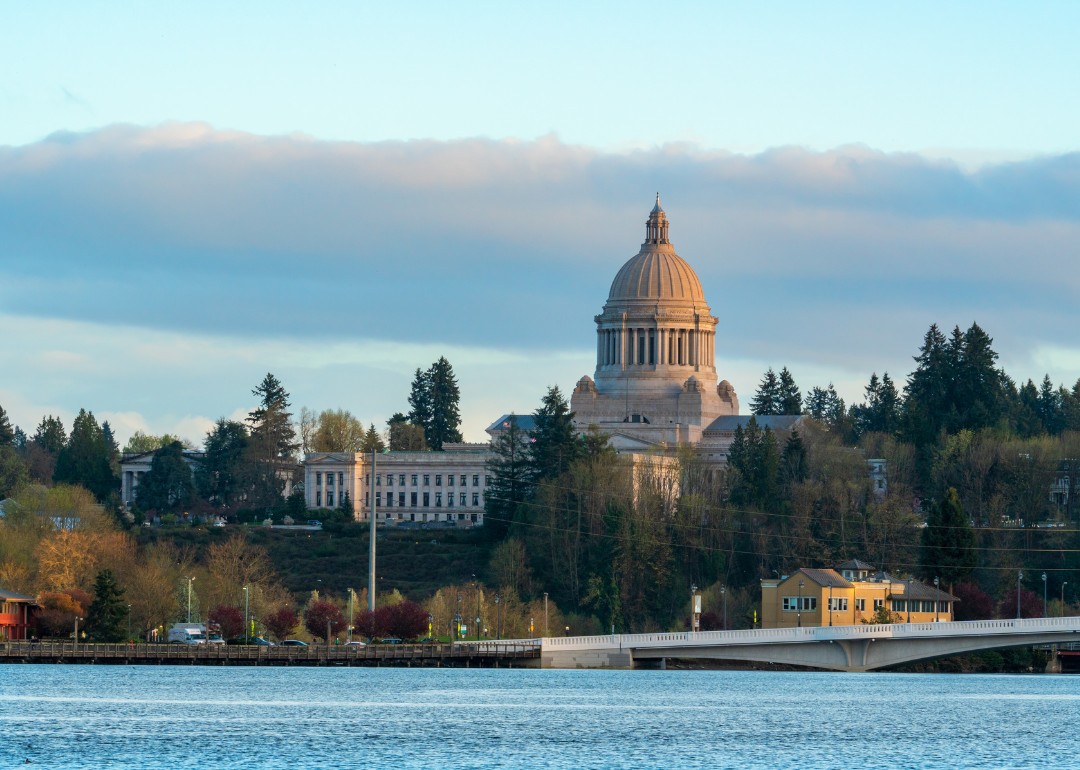
#34. Washington
- Percentage of allotment remaining: 49.4%
- Total funding from the IIJA: $8.6 billion ($558 per capita)
- Funding for projects as of April 20, 2023: $4.3 billion
--- Transportation: $3.1 billion
--- Climate, Energy, and the Environment: $1.1 billion
--- Broadband: $106.0 million
--- Other: $51.9 million
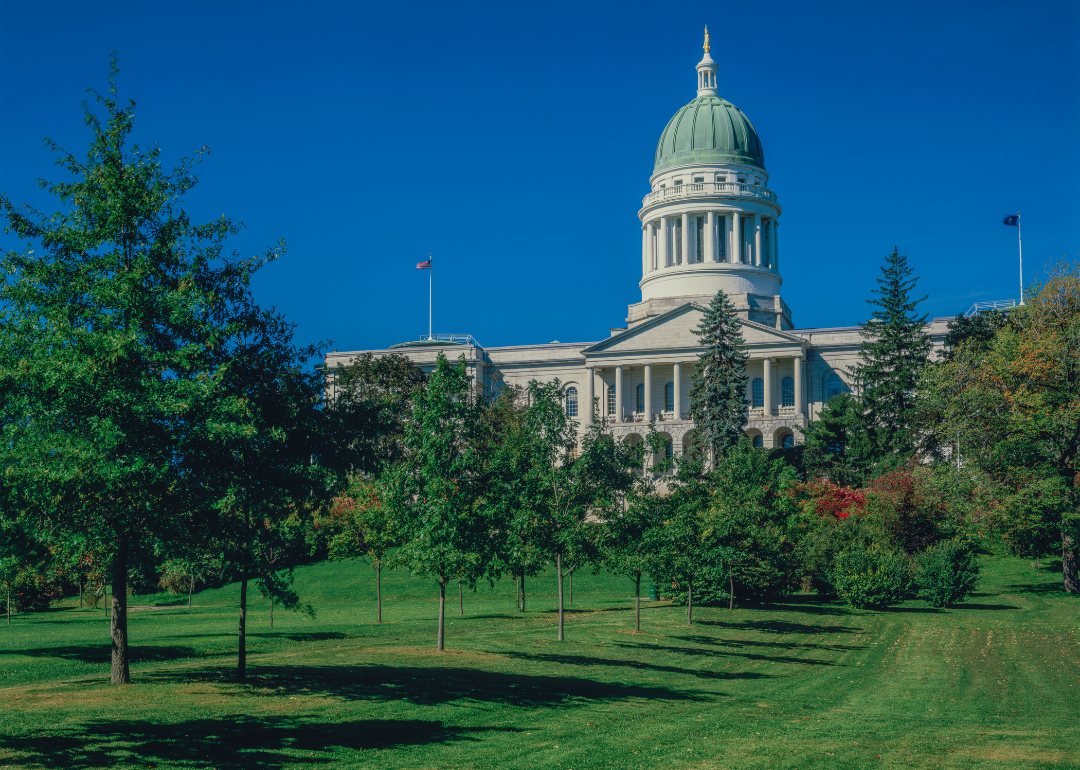
#33. Maine
- Percentage of allotment remaining: 49.7%
- Total funding from the IIJA: $2.4 billion ($858 per capita)
- Funding for projects as of April 20, 2023: $1.2 billion
--- Transportation: $874.2 million
--- Climate, Energy, and the Environment: $280.1 million
--- Broadband: $6.5 million
--- Other: $28.2 million
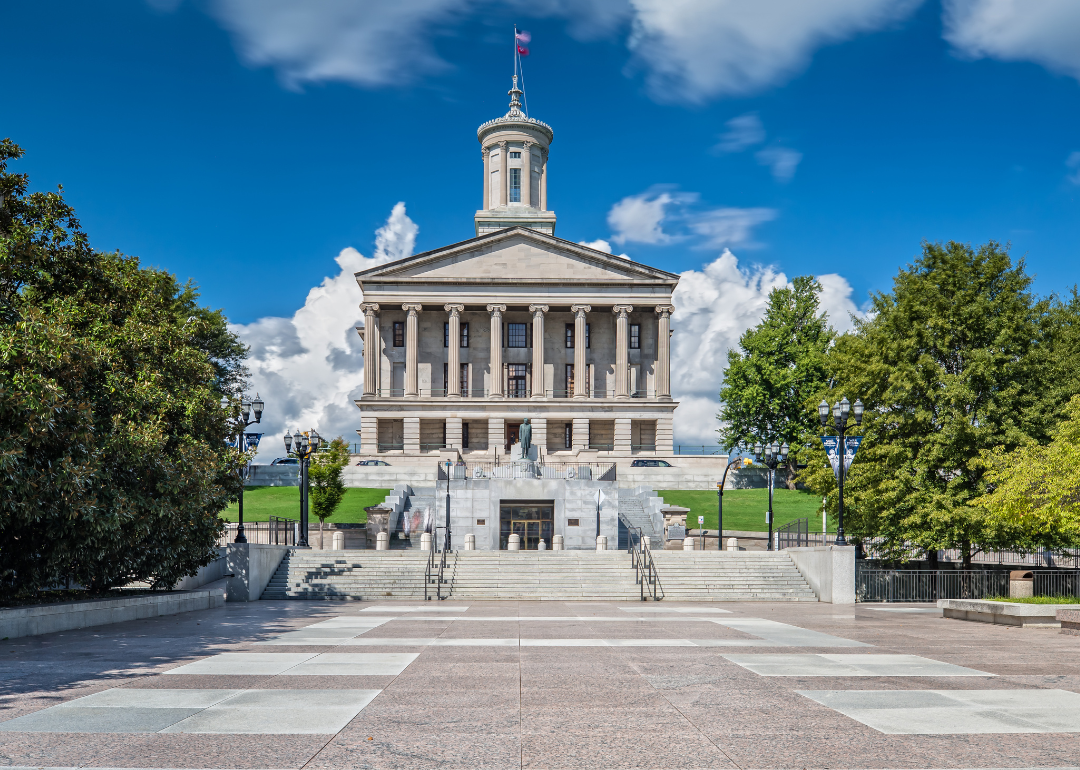
#32. Tennessee
- Percentage of allotment remaining: 50.0%
- Total funding from the IIJA: $8.0 billion ($564 per capita)
- Funding for projects as of April 20, 2023: $4.0 billion
--- Transportation: $2.9 billion
--- Climate, Energy, and the Environment: $1.0 billion
--- Broadband: $6.0 million
--- Other: $3.3 million

#31. Pennsylvania
- Percentage of allotment remaining: 50.2%
- Total funding from the IIJA: $17.8 billion ($683 per capita)
- Funding for projects as of April 20, 2023: $8.9 billion
--- Transportation: $6.5 billion
--- Climate, Energy, and the Environment: $2.4 billion
--- Broadband: $6.6 million
--- Other: $3.4 million
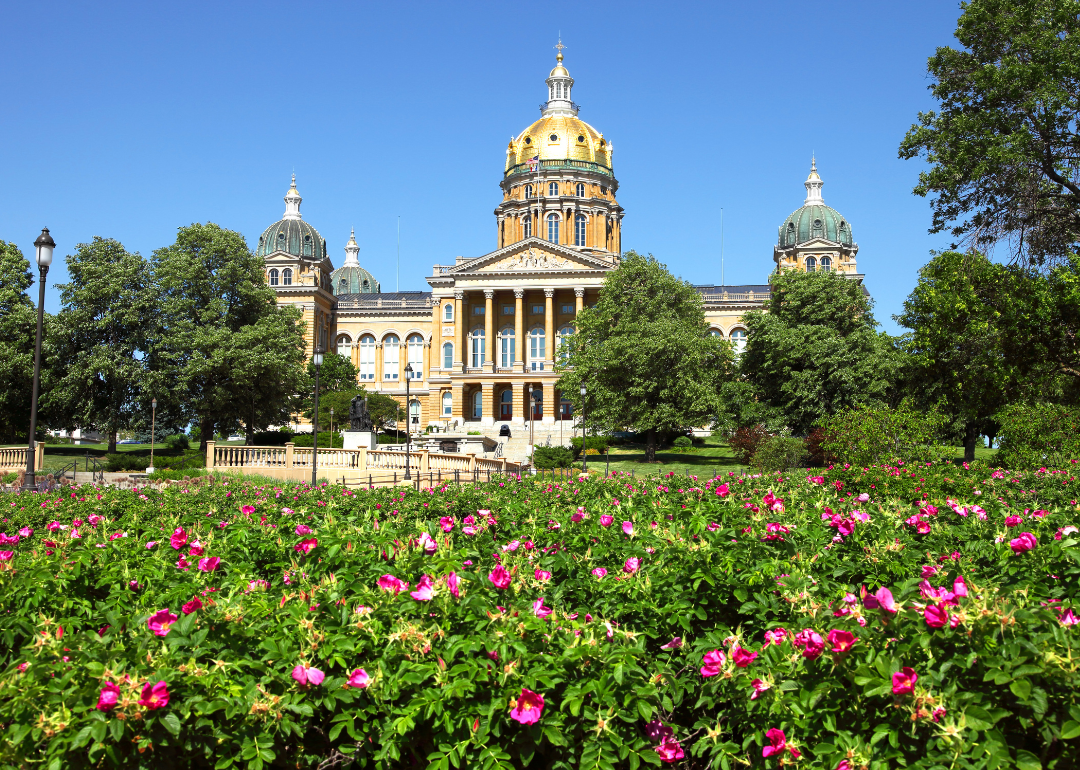
#30. Iowa
- Percentage of allotment remaining: 51.0%
- Total funding from the IIJA: $5.1 billion ($778 per capita)
- Funding for projects as of April 20, 2023: $2.5 billion
--- Transportation: $2.1 billion
--- Climate, Energy, and the Environment: $381.2 million
--- Broadband: $13.5 million
--- Other: $5.5 million

#29. West Virginia
- Percentage of allotment remaining: 51.4%
- Total funding from the IIJA: $4.4 billion ($1,204 per capita)
- Funding for projects as of April 20, 2023: $2.1 billion
--- Transportation: $1.6 billion
--- Climate, Energy, and the Environment: $539.8 million
--- Broadband: $5.7 million
--- Other: $882.8 thousand

#28. Florida
- Percentage of allotment remaining: 51.9%
- Total funding from the IIJA: $19.1 billion ($413 per capita)
- Funding for projects as of April 20, 2023: $9.2 billion
--- Transportation: $6.7 billion
--- Climate, Energy, and the Environment: $2.4 billion
--- Broadband: $7.4 million
--- Other: $5.8 million
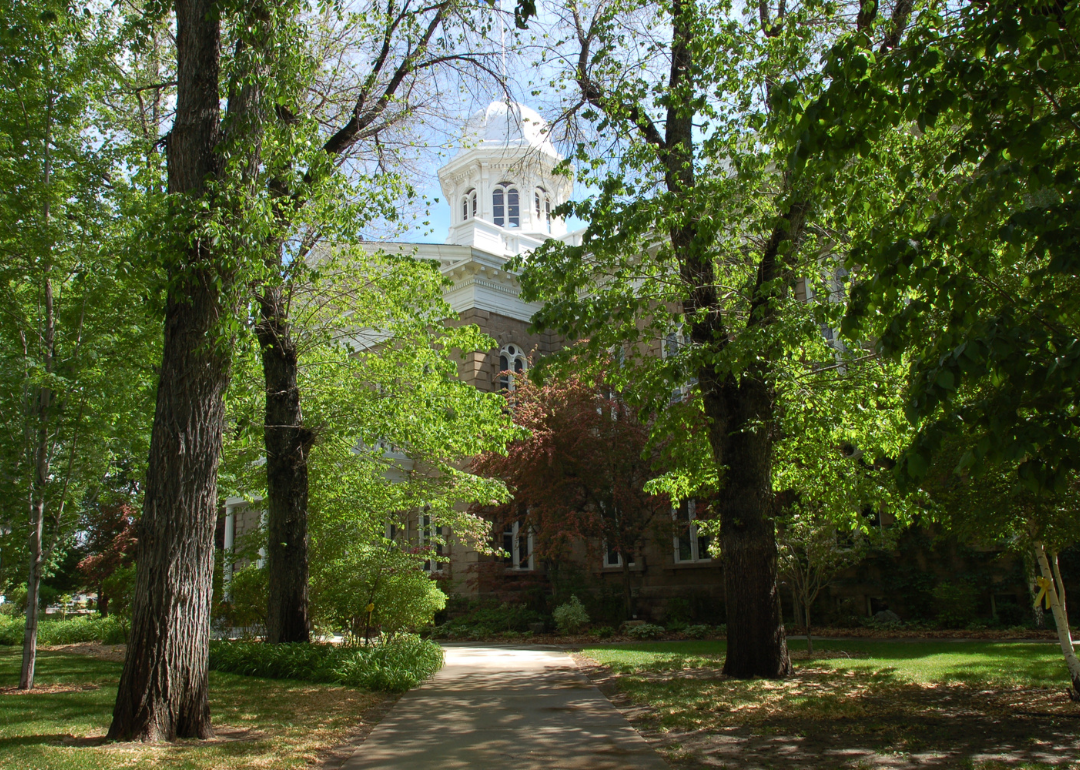
#27. Nevada
- Percentage of allotment remaining: 52.3%
- Total funding from the IIJA: $4.0 billion ($607 per capita)
- Funding for projects as of April 20, 2023: $1.9 billion
--- Transportation: $1.5 billion
--- Climate, Energy, and the Environment: $416.2 million
--- Broadband: $37.1 million
--- Other: $1.3 million
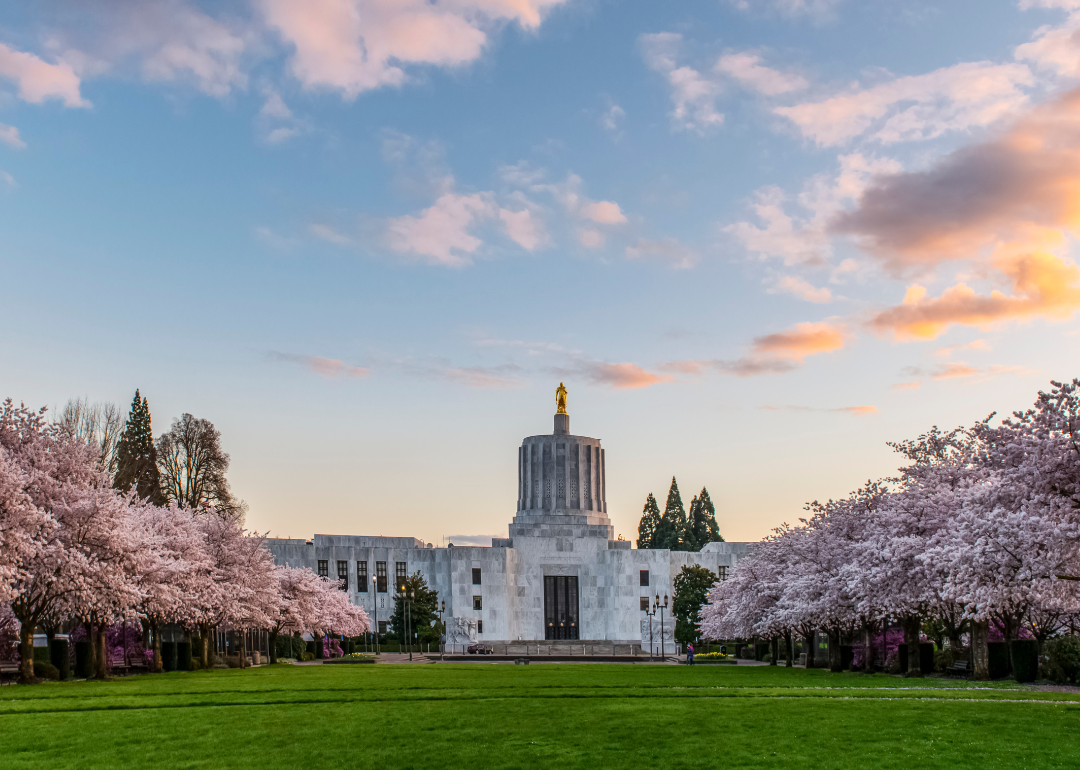
#26. Oregon
- Percentage of allotment remaining: 52.4%
- Total funding from the IIJA: $5.4 billion ($602 per capita)
- Funding for projects as of April 20, 2023: $2.6 billion
--- Transportation: $1.9 billion
--- Climate, Energy, and the Environment: $505.4 million
--- Broadband: $88.8 million
--- Other: $38.5 million

#25. Nebraska
- Percentage of allotment remaining: 52.5%
- Total funding from the IIJA: $3.0 billion ($734 per capita)
- Funding for projects as of April 20, 2023: $1.4 billion
--- Transportation: $1.0 billion
--- Climate, Energy, and the Environment: $358.7 million
--- Broadband: $45.8 million
--- Other: $898.4 thousand

#24. North Carolina
- Percentage of allotment remaining: 52.7%
- Total funding from the IIJA: $10.4 billion ($460 per capita)
- Funding for projects as of April 20, 2023: $4.9 billion
--- Transportation: $3.9 billion
--- Climate, Energy, and the Environment: $1.0 billion
--- Broadband: $23.9 million
--- Other: $13.6 million

#23. Virginia
- Percentage of allotment remaining: 53.1%
- Total funding from the IIJA: $10.1 billion ($546 per capita)
- Funding for projects as of April 20, 2023: $4.7 billion
--- Transportation: $3.8 billion
--- Climate, Energy, and the Environment: $917.1 million
--- Broadband: $6.7 million
--- Other: $5.6 million
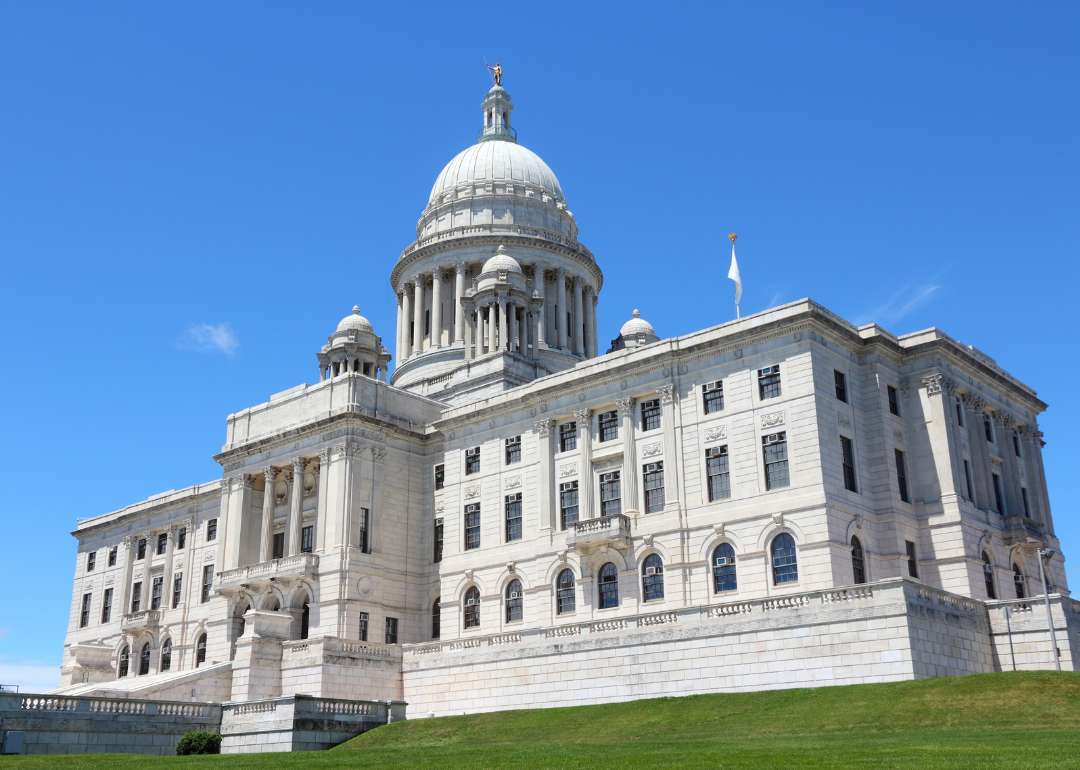
#22. Rhode Island
- Percentage of allotment remaining: 54.1%
- Total funding from the IIJA: $2.6 billion ($1,079 per capita)
- Funding for projects as of April 20, 2023: $1.2 billion
--- Transportation: $926.5 million
--- Climate, Energy, and the Environment: $247.6 million
--- Broadband: $5.5 million
--- Other: $672.4 thousand
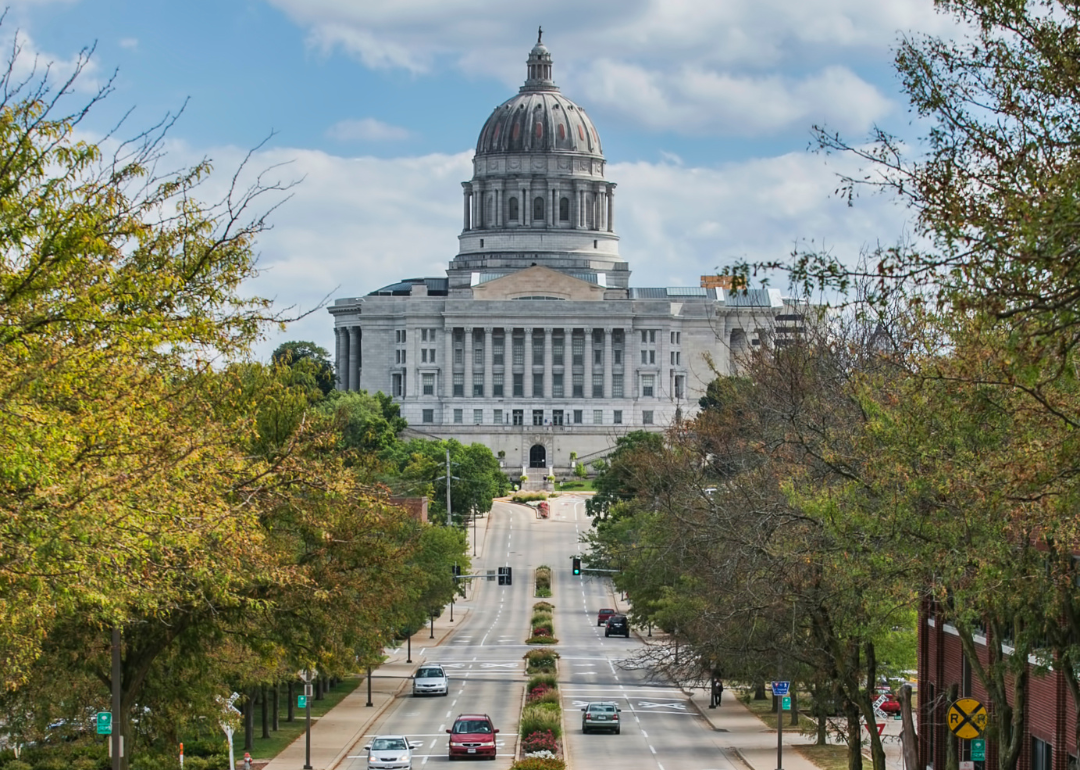
#21. Missouri
- Percentage of allotment remaining: 54.8%
- Total funding from the IIJA: $9.0 billion ($659 per capita)
- Funding for projects as of April 20, 2023: $4.1 billion
--- Transportation: $3.1 billion
--- Climate, Energy, and the Environment: $848.1 million
--- Broadband: $103.3 million
--- Other: $4.0 million
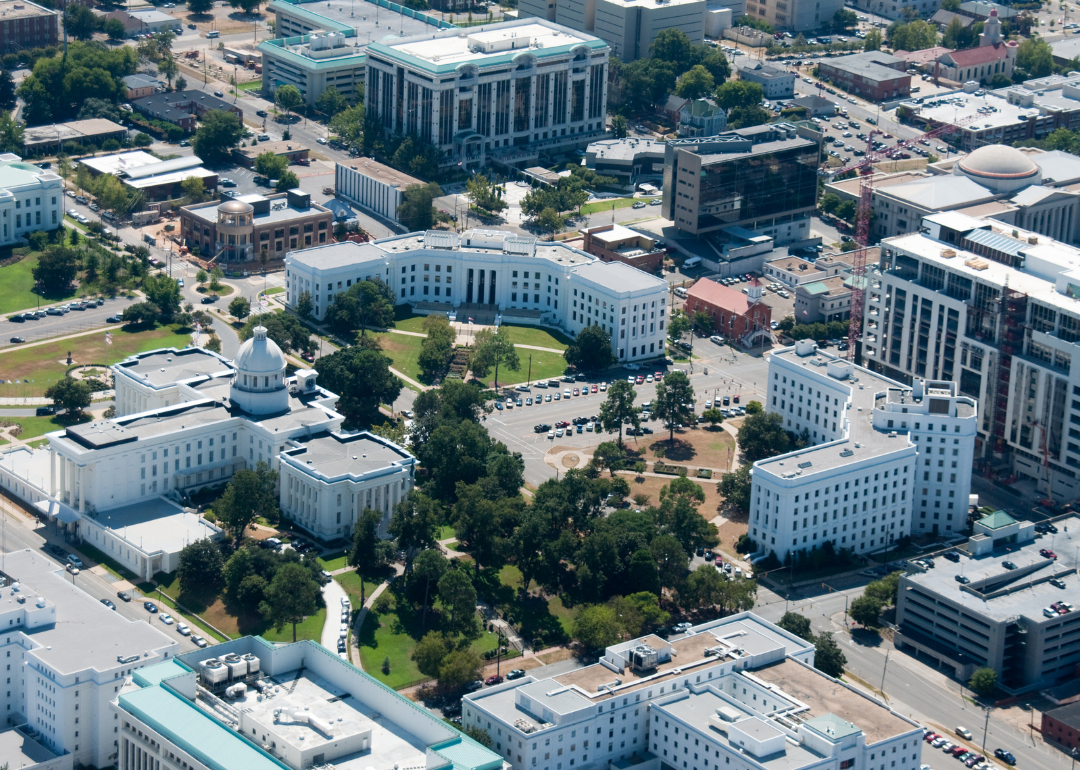
#20. Alabama
- Percentage of allotment remaining: 54.8%
- Total funding from the IIJA: $7.0 billion ($620 per capita)
- Funding for projects as of April 20, 2023: $3.1 billion
--- Transportation: $2.6 billion
--- Climate, Energy, and the Environment: $504.2 million
--- Broadband: $55.5 million
--- Other: $4.9 million
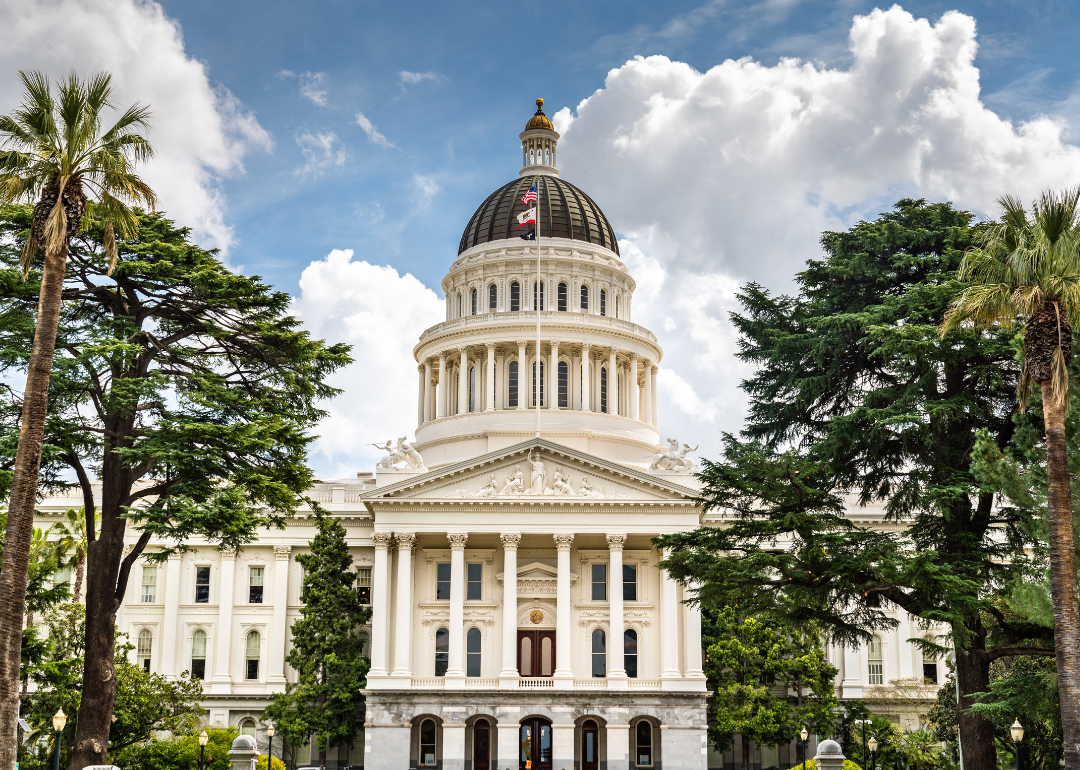
#19. California
- Percentage of allotment remaining: 55.2%
- Total funding from the IIJA: $44.6 billion ($511 per capita)
- Funding for projects as of April 20, 2023: $20.0 billion
--- Transportation: $15.1 billion
--- Climate, Energy, and the Environment: $4.6 billion
--- Broadband: $176.5 million
--- Other: $36.1 million
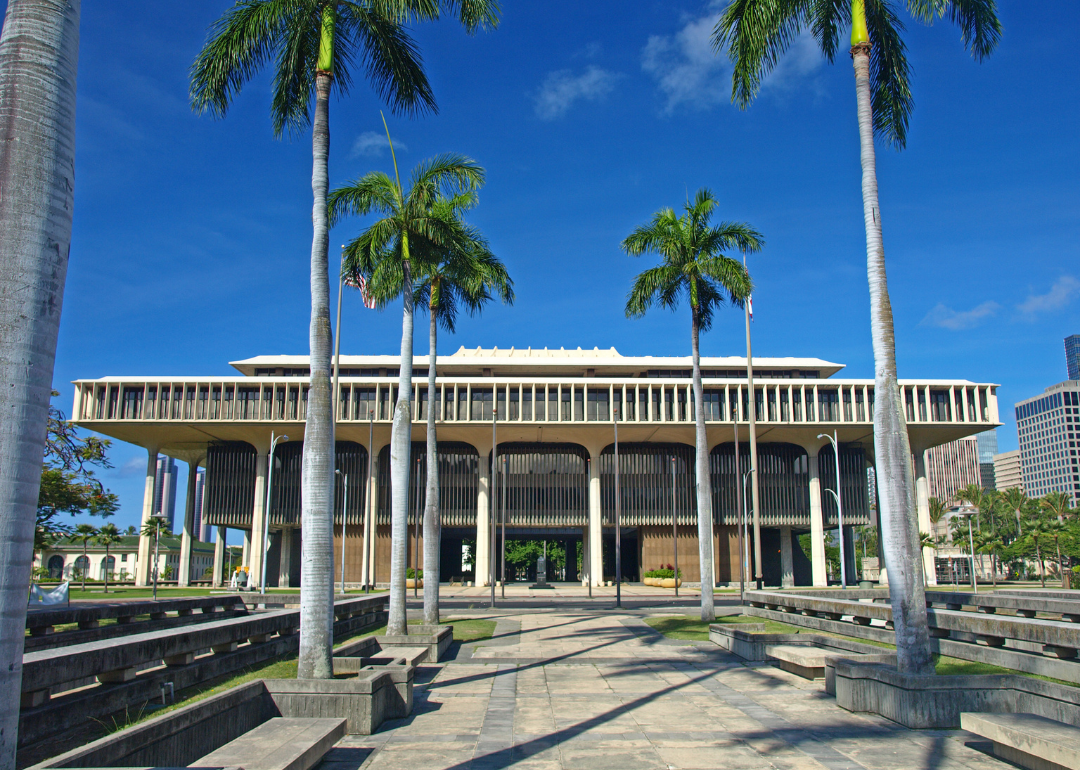
#18. Hawaii
- Percentage of allotment remaining: 55.3%
- Total funding from the IIJA: $2.6 billion ($814 per capita)
- Funding for projects as of April 20, 2023: $1.2 billion
--- Transportation: $935.2 million
--- Climate, Energy, and the Environment: $214.1 million
--- Broadband: $22.9 million
--- Other: $167.0 thousand

#17. Idaho
- Percentage of allotment remaining: 55.9%
- Total funding from the IIJA: $3.0 billion ($688 per capita)
- Funding for projects as of April 20, 2023: $1.3 billion
--- Transportation: $1.0 billion
--- Climate, Energy, and the Environment: $290.3 million
--- Broadband: $31.6 million
--- Other: $8.7 million
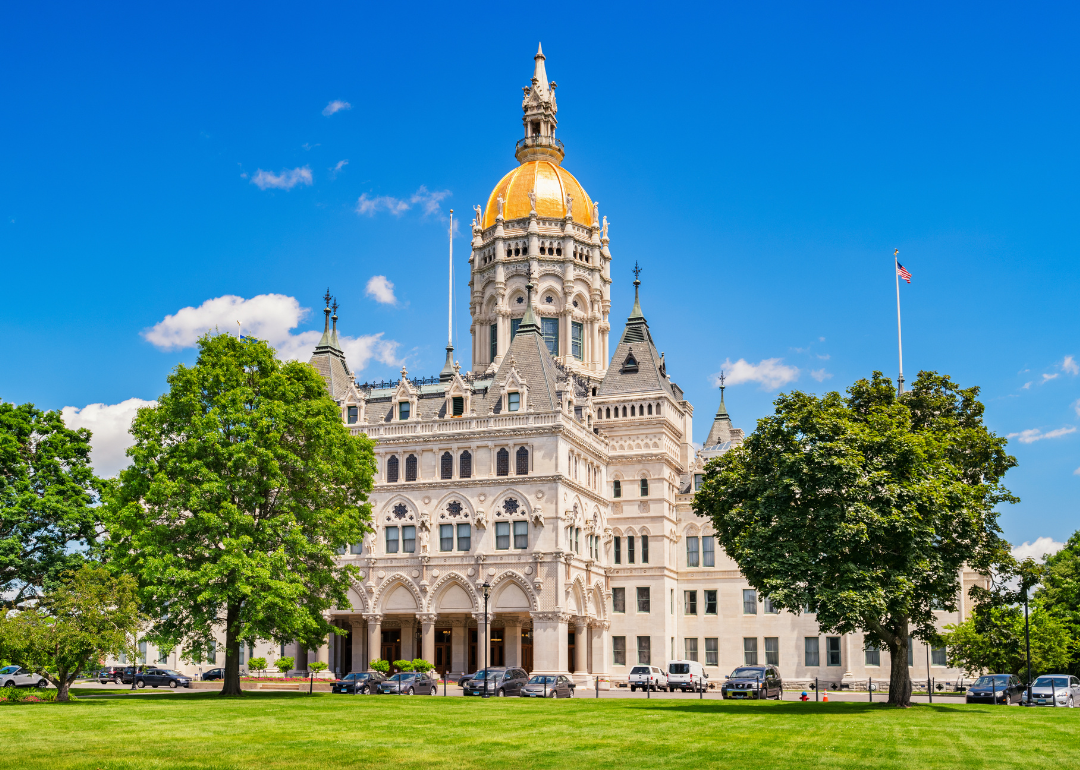
#16. Connecticut
- Percentage of allotment remaining: 56.2%
- Total funding from the IIJA: $6.0 billion ($730 per capita)
- Funding for projects as of April 20, 2023: $2.6 billion
--- Transportation: $2.2 billion
--- Climate, Energy, and the Environment: $377.3 million
--- Broadband: $5.7 million
--- Other: $17.0 million
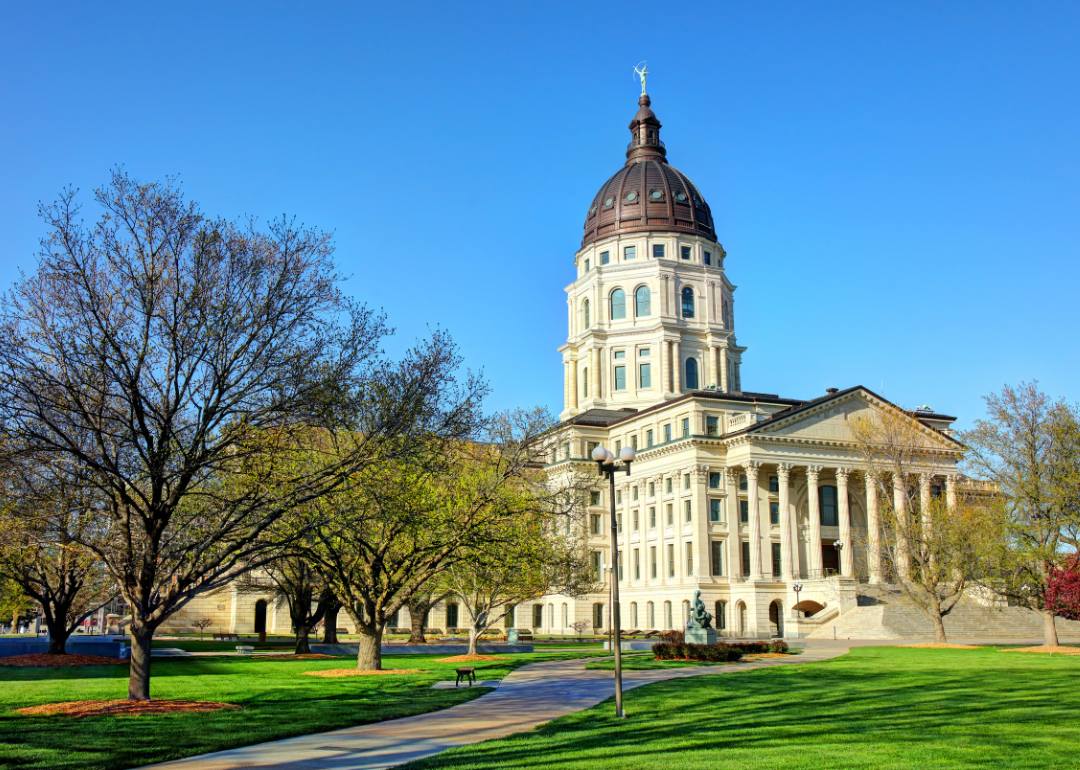
#15. Kansas
- Percentage of allotment remaining: 56.3%
- Total funding from the IIJA: $3.8 billion ($571 per capita)
- Funding for projects as of April 20, 2023: $1.7 billion
--- Transportation: $1.3 billion
--- Climate, Energy, and the Environment: $361.0 million
--- Broadband: $15.5 million
--- Other: $235.6 thousand

#14. Vermont
- Percentage of allotment remaining: 56.3%
- Total funding from the IIJA: $2.2 billion ($1,502 per capita)
- Funding for projects as of April 20, 2023: $972.0 million
--- Transportation: $714.2 million
--- Climate, Energy, and the Environment: $251.7 million
--- Broadband: $5.5 million
--- Other: $580.5 thousand
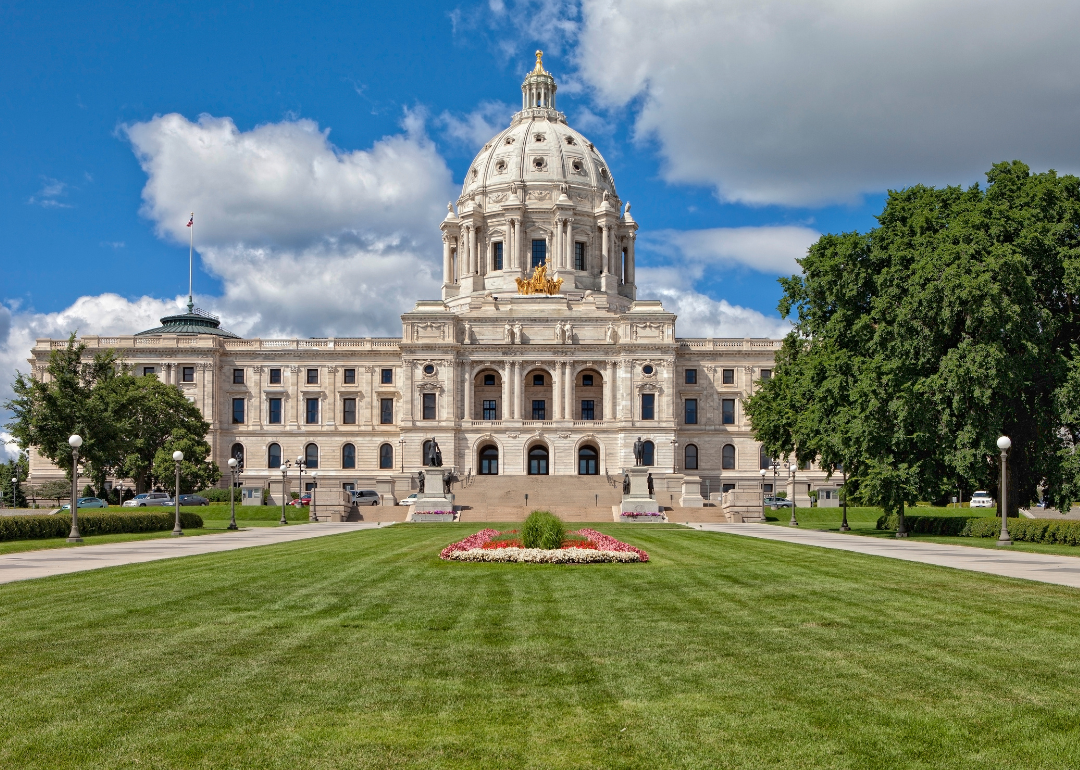
#13. Minnesota
- Percentage of allotment remaining: 56.5%
- Total funding from the IIJA: $6.8 billion ($518 per capita)
- Funding for projects as of April 20, 2023: $3.0 billion
--- Transportation: $2.4 billion
--- Climate, Energy, and the Environment: $437.5 million
--- Broadband: $97.1 million
--- Other: $2.1 million

#12. Massachusetts
- Percentage of allotment remaining: 56.7%
- Total funding from the IIJA: $9.3 billion ($579 per capita)
- Funding for projects as of April 20, 2023: $4.0 billion
--- Transportation: $3.3 billion
--- Climate, Energy, and the Environment: $680.4 million
--- Broadband: $15.1 million
--- Other: $8.5 million
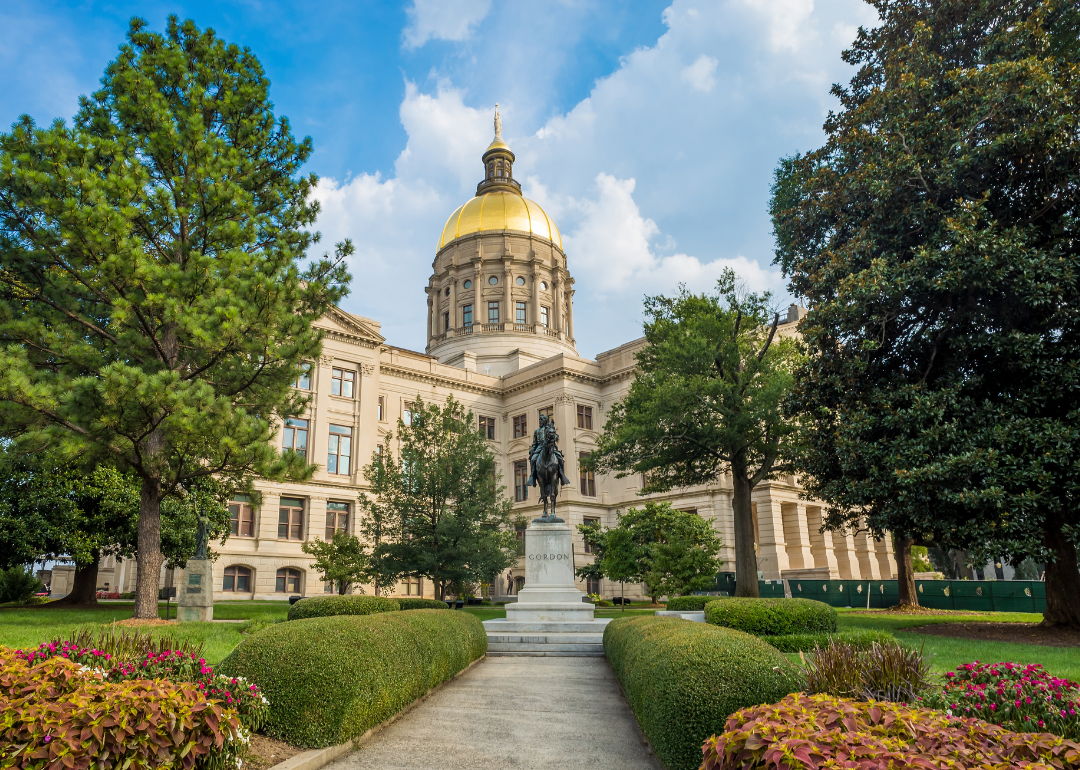
#11. Georgia
- Percentage of allotment remaining: 57.1%
- Total funding from the IIJA: $12.4 billion ($487 per capita)
- Funding for projects as of April 20, 2023: $5.3 billion
--- Transportation: $4.4 billion
--- Climate, Energy, and the Environment: $882.7 million
--- Broadband: $42.9 million
--- Other: $4.6 million

#10. Wisconsin
- Percentage of allotment remaining: 57.3%
- Total funding from the IIJA: $7.3 billion ($527 per capita)
- Funding for projects as of April 20, 2023: $3.1 billion
--- Transportation: $2.5 billion
--- Climate, Energy, and the Environment: $575.5 million
--- Broadband: $39.7 million
--- Other: $2.2 million
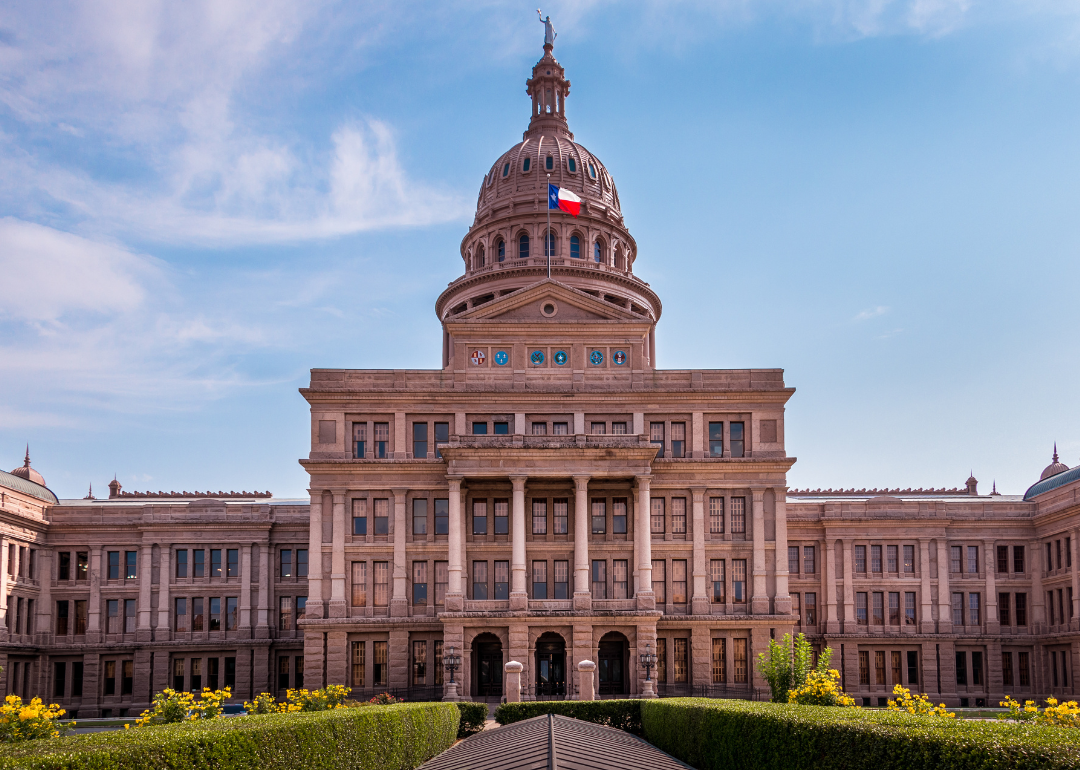
#9. Texas
- Percentage of allotment remaining: 57.5%
- Total funding from the IIJA: $35.4 billion ($501 per capita)
- Funding for projects as of April 20, 2023: $15.0 billion
--- Transportation: $12.6 billion
--- Climate, Energy, and the Environment: $2.4 billion
--- Broadband: $15.5 million
--- Other: $9.8 million

#8. South Carolina
- Percentage of allotment remaining: 58.2%
- Total funding from the IIJA: $6.1 billion ($484 per capita)
- Funding for projects as of April 20, 2023: $2.6 billion
--- Transportation: $2.2 billion
--- Climate, Energy, and the Environment: $337.4 million
--- Broadband: $6.0 million
--- Other: $3.3 million
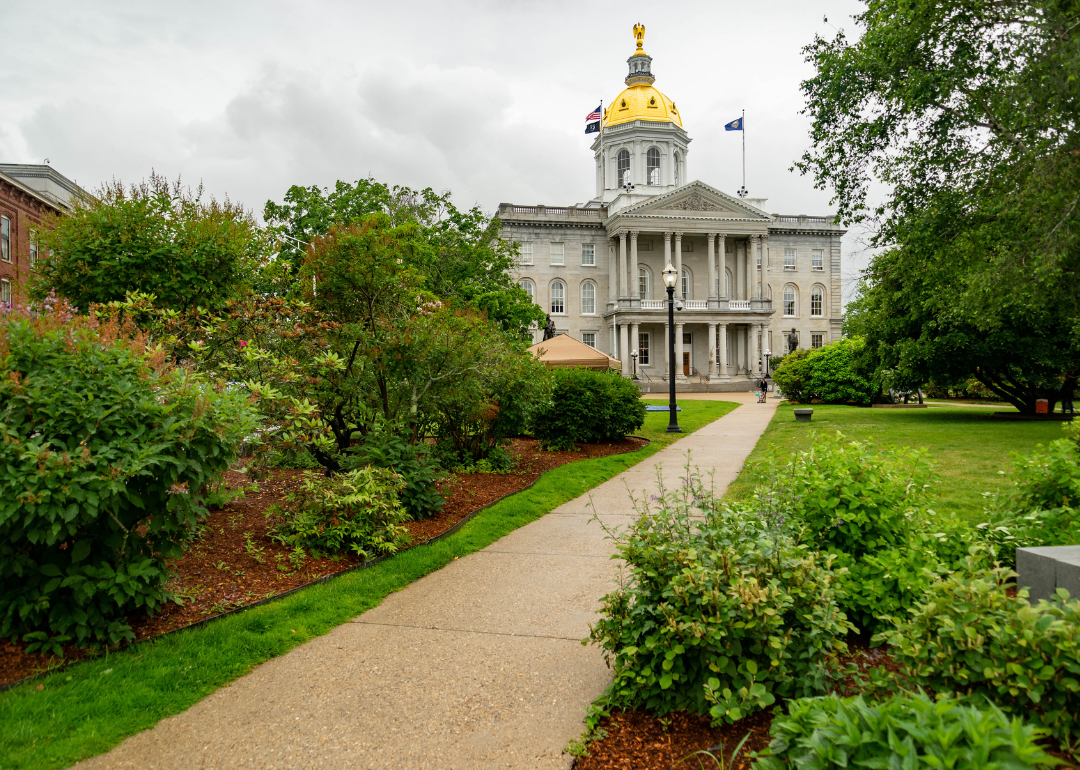
#7. New Hampshire
- Percentage of allotment remaining: 58.3%
- Total funding from the IIJA: $2.0 billion ($613 per capita)
- Funding for projects as of April 20, 2023: $855.2 million
--- Transportation: $619.3 million
--- Climate, Energy, and the Environment: $226.0 million
--- Broadband: $5.5 million
--- Other: $4.3 million
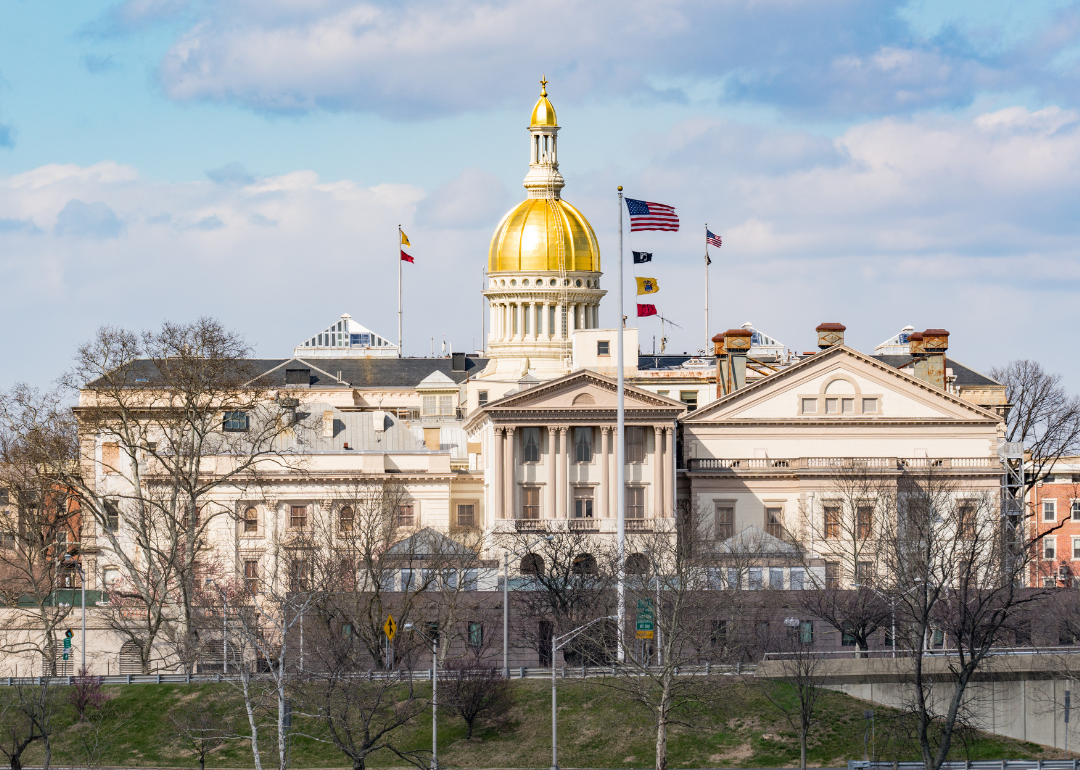
#6. New Jersey
- Percentage of allotment remaining: 58.6%
- Total funding from the IIJA: $13.5 billion ($604 per capita)
- Funding for projects as of April 20, 2023: $5.6 billion
--- Transportation: $4.4 billion
--- Climate, Energy, and the Environment: $1.2 billion
--- Broadband: $6.1 million
--- Other: $3.9 million

#5. Indiana
- Percentage of allotment remaining: 59.3%
- Total funding from the IIJA: $8.8 billion ($527 per capita)
- Funding for projects as of April 20, 2023: $3.6 billion
--- Transportation: $3.0 billion
--- Climate, Energy, and the Environment: $593.5 million
--- Broadband: $5.8 million
--- Other: $1.5 million

#4. New York
- Percentage of allotment remaining: 59.5%
- Total funding from the IIJA: $26.9 billion ($555 per capita)
- Funding for projects as of April 20, 2023: $10.9 billion
--- Transportation: $9.0 billion
--- Climate, Energy, and the Environment: $1.9 billion
--- Broadband: $16.9 million
--- Other: $6.4 million
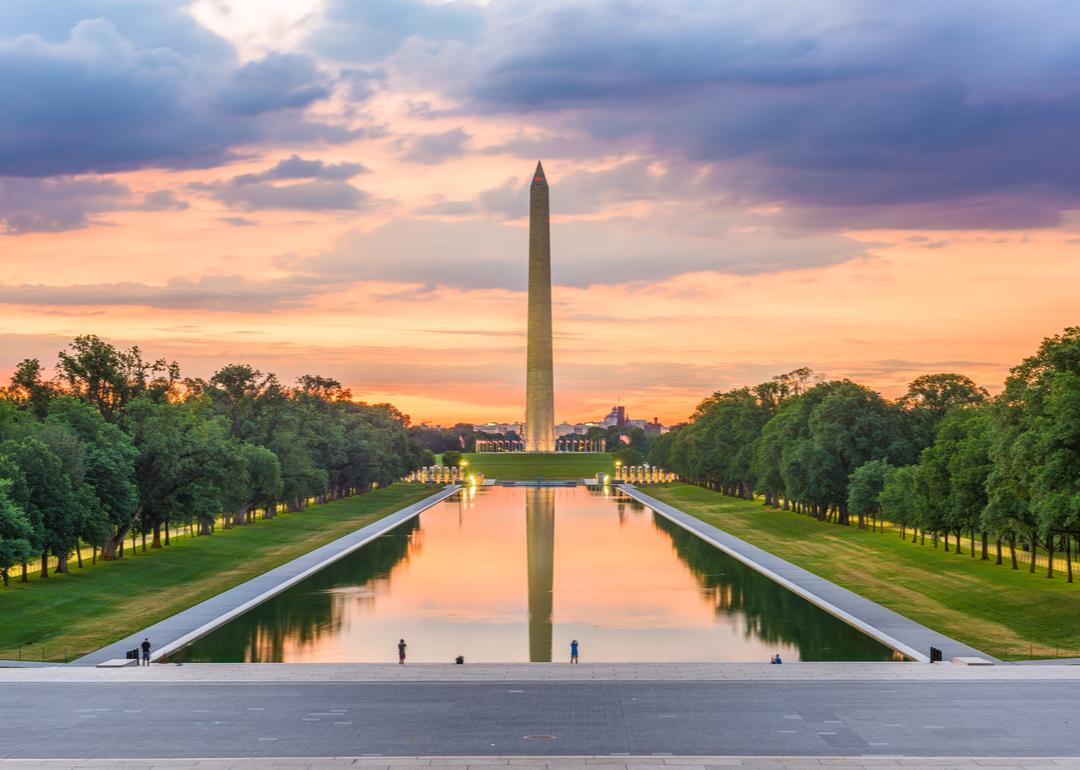
#3. Washington D.C.
- Percentage of allotment remaining: 59.7%
- Total funding from the IIJA: $3.0 billion ($1,804 per capita)
- Funding for projects as of April 20, 2023: $1.2 billion
--- Transportation: $924.8 million
--- Climate, Energy, and the Environment: $280.3 million
--- Broadband: $5.5 million
--- Other: $1.3 million

#2. Maryland
- Percentage of allotment remaining: 59.9%
- Total funding from the IIJA: $7.4 billion ($481 per capita)
- Funding for projects as of April 20, 2023: $3.0 billion
--- Transportation: $2.4 billion
--- Climate, Energy, and the Environment: $539.8 million
--- Broadband: $6.0 million
--- Other: $1.7 million

#1. Delaware
- Percentage of allotment remaining: 63.6%
- Total funding from the IIJA: $2.4 billion ($850 per capita)
- Funding for projects as of April 20, 2023: $866.1 million
--- Transportation: $650.9 million
--- Climate, Energy, and the Environment: $209.4 million
--- Broadband: $5.5 million
--- Other: $355.4 thousand
Data reporting by Sam Larson. Story editing by Brian Budzynski. Copy editing by Tim Bruns. Photo selection by Abigail Renaud.