
50 indicators for understanding America's economy right now
50 indicators for understanding America's economy right now
The COVID-19 pandemic has drastically changed life for everyone. Stores and restaurants shut down, travel bans were put in place, the price of food has gone up, and many businesses asked staff to work from home—if they were able to keep them employed at all. Other companies, facing a massive decline in business, had to lay off entire swaths of their workforce, creating new financial struggles for millions of people. It’s been a challenge across the board.
These changes can be felt every time we check our bank balance. People who have lost their jobs might be watching their grocery budget very carefully and wondering how they can afford to pay their rent, even if they're getting unemployment benefits. Those who continued working might have actually seen their credit card bills go down and their savings tick upward—after all, with restaurants, bars, theaters, and retail stores closed, what’s left to spend money on? Plus, with the future so uncertain, it’s not the worst idea to invest in your rainy-day fund while you have the money.
Microeconomics on the personal or household level tell one story about the coronavirus crisis. But how’s the pandemic shaking out on the national scale? To help understand America’s economy right now, Stacker compiled a list of 50 different economic indicators from a variety of sources. We looked at things like the unemployment rate, the S&P 500, public transit ridership, box office revenue, and the price of gold. As you would probably expect, many of the statistics paint a dismal picture. More than 2.1 million people filed their first claim for unemployment benefits in the week ending May 23. The rate of gross domestic product growth has tumbled by 5%. And automakers have seen an extreme drop in car sales in recent months.
However, it’s not all doom and gloom. Some statistics, like the rising home sales price, offer a glimpse of hope that the pandemic hasn’t completely wrecked the economy, and a swift recovery may be on the horizon. Click through to see how the economy has changed over the last few months, and what these economic indicators might mean for your life.
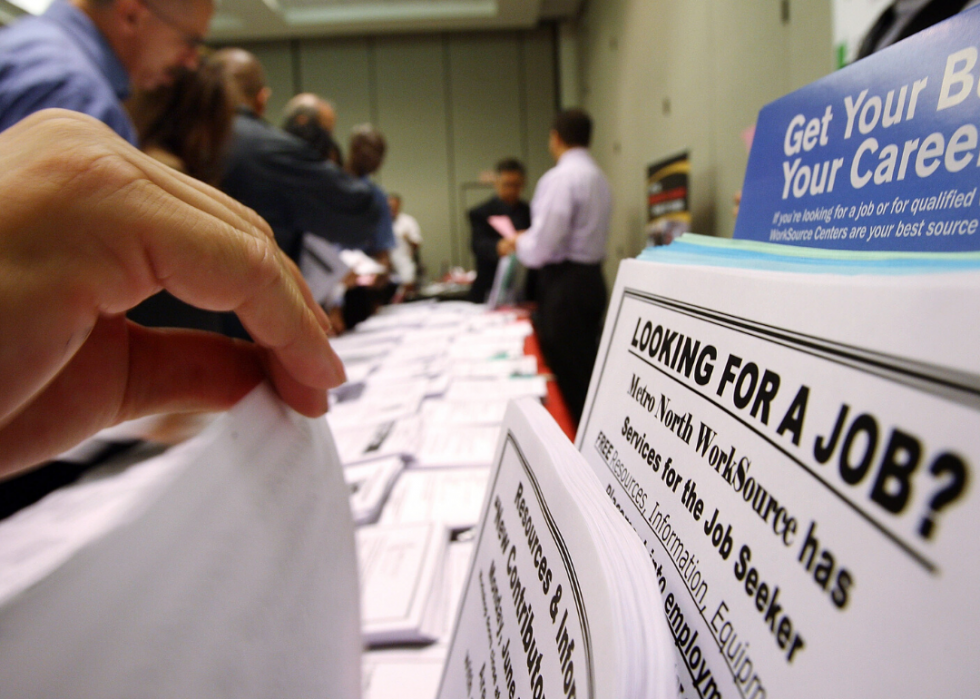
Unemployment rate
- Unemployment rate (April 2020): 14.7%
- Change since February 2020: +11.2%
Many businesses across the country were forced to close during coronavirus-related shutdowns in March and April. As a result, nearly 40 million laid-off workers applied for unemployment benefits during the pandemic.
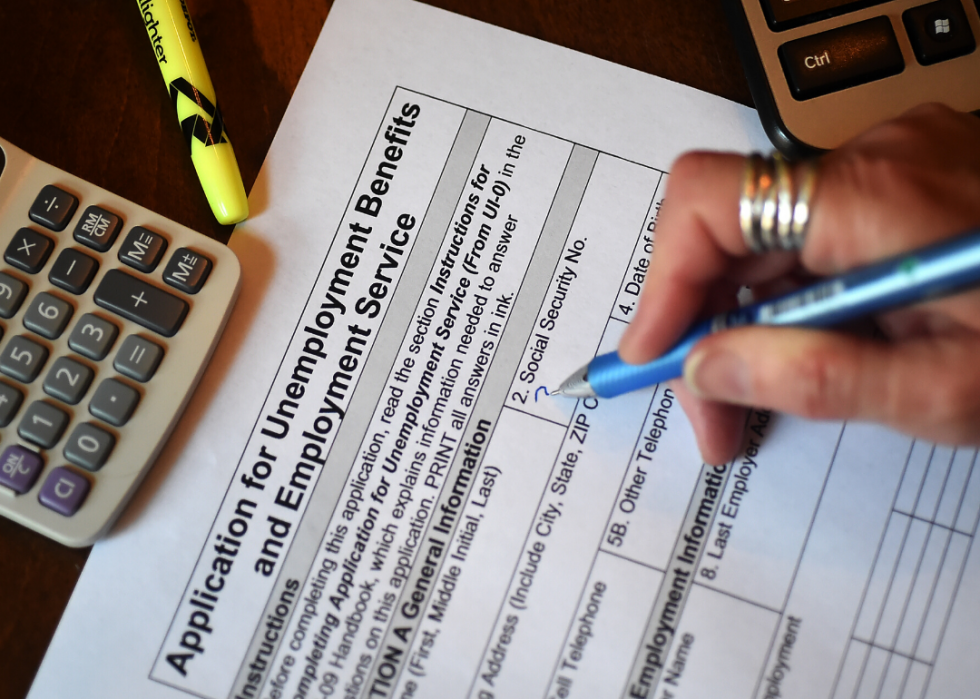
Unemployment claims
- Initial unemployment claims seasonally adjusted (week ending May 23, 2020): 2,123,000
More than 2.1 million people filed a new unemployment claim for the week ending May 23. It indicates that companies that retained their staff through March and April may have needed to close in mid-May, or may have faced a slowdown that affected their ability to keep people employed.

Workforce participation
- Civilian labor force participation rate (April 2020): 60.2%
- Change since February 2020: -3.2%
The civilian labor force participation rate divides the sum of all workers in the country who have jobs (or are actively looking for employment) by the total population of working-age, non-institutionalized civilians to measure the economy’s active workforce. The coronavirus pandemic was a major blow to the workforce participation rate in the U.S., causing it to hit its lowest figure in April since January 1973.
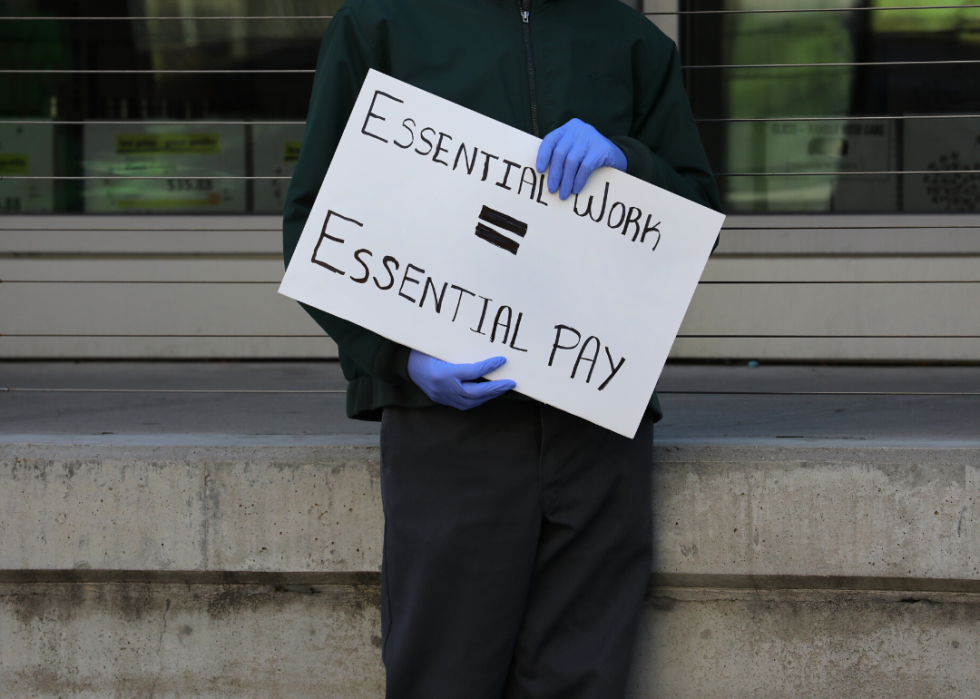
Wages
- Change in total private average hourly earnings for all employees (April 2020): +$1.34
Average hourly earnings for workers in the private sector jumped $1.34 in April. The jump could be reflective of the loss of low-wage jobs in the economy during the pandemic, an increase in states’ minimum wages over the last few years, and/or the extra hazard pay some workers received from their companies.

Manufacturing hours worked
- Average workweek for employees on manufacturing private payrolls (April 2020): 38.3 hours
- Change from March 2020: -2.1 hours
- Average overtime (April 2020): 2.1 hours
- Change from March 2020: -0.9 hours
The average workweek for manufacturing workers dropped by around 2 hours in April compared to March. Assembly-line workers are considered at higher risk of coronavirus infection because they tend to work long hours in close proximity to one another. Manufacturers, such those in the auto industry, began shutting down their plants in mid-March to protect their employees and adhere to state guidance, which likely contributed to the shorter average workweek.
You may also like: 12 original companies in the Dow Jones Industrial Average (and what happened to them)

CPI
- Consumer price index (April 2020): -0.8%
The consumer price index measures adjustments in the cost of goods and services in urban areas. The monthly decline in April was the sharpest the consumer price index has seen since December 2008, largely driven by a 20.6% drop in the gas index.

CPI - food
- Food CPI (April 2020): +3.5%
The consumer price index for food rose 3.5% in the 12 months leading up to April 2020—the largest 12-month jump since February 2012. The increase in food prices may have been driven by closures and slowdowns of meat processing plants and a shift toward people buying food at grocery stores, rather than at restaurants and institutions, according to Susan Selasky of the Detroit Free Press.

CPI excluding food and energy prices
- CPI all items except food and energy (April 2020): +1.4%
The consumer price index for all items except food and energy rose 1.4% in April, signaling a period of inflation. This measurement can help economists analyze “core inflation” that’s not influenced by erratic spikes in products like food and energy, which tend to have more volatile pricing than other goods and services.
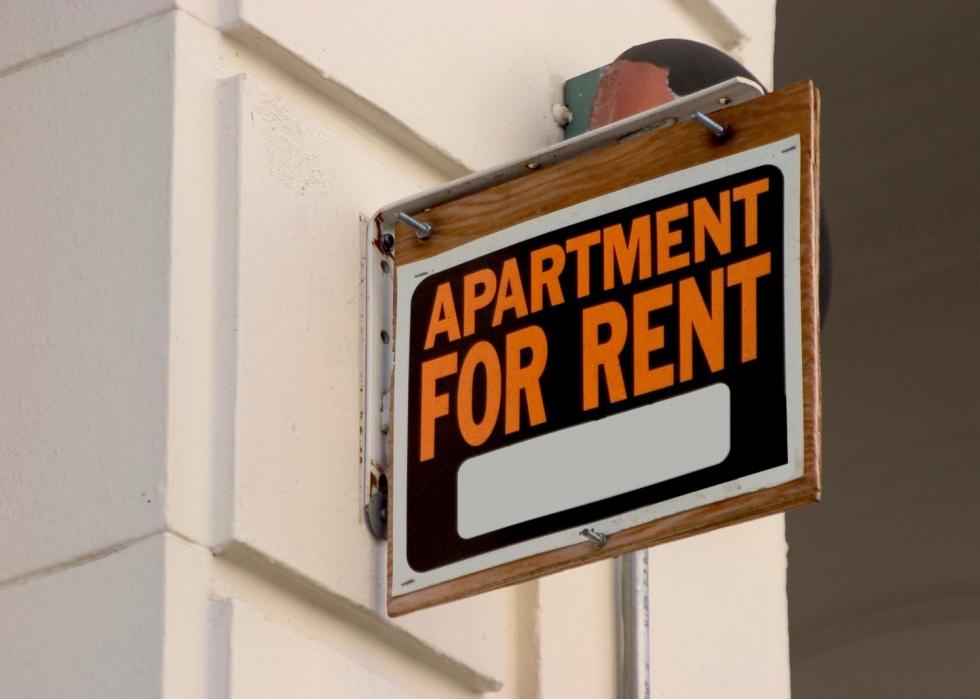
Rent
- Monthly rent growth (April 2020): 2.9%
Rents continued to rise in April, but only by 2.9%—its slowest one-month pace since at least 2014. The measurement is consistent with the overall economic slowdown caused by the pandemic.

Home sales price
- Median home value (March 2020): $248,857
- Year-over-year median home value: +4.1%
- Year-over-year for sale inventory: -9.5%
Home values continued to rise in March, but not nearly as rapidly as they did in previous years. It may indicate that home prices have seen their peak, especially in major cities like Los Angeles, Miami, and San Francisco, according to Zillow.

Building permits
- New privately-owned housing units authorized by building permits seasonally adjusted (April 2020): 1.1 million units
- Change since February 2020: -372,000 units
Building permits have been on the decline during the pandemic, falling 372,000 units between February and April. The figures may indicate that a deep economic contraction is coming later this year, according to Lucia Mutikani of Reuters.
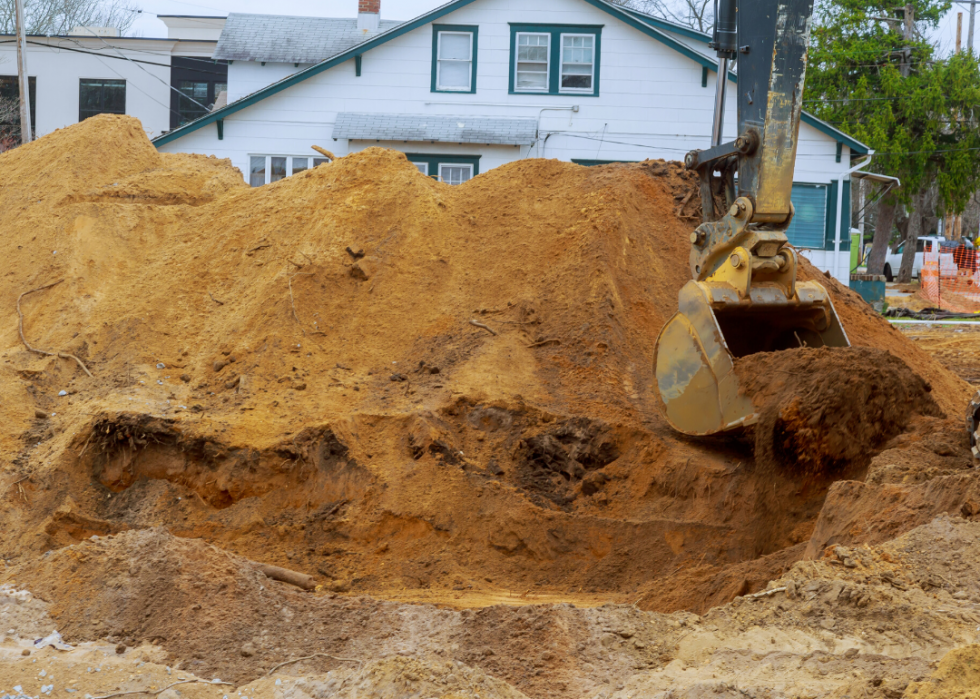
Housing starts
- New privately-owned housing units starts seasonally adjusted (April 2020): 891,000 units
- Change since February 2020: -676,000 units
Monthly housing starts, or the beginning of excavation on the foundation for a residential building, fell by 676,000 units between February and April. Those numbers are nearly 30% below the housing starts in April 2019, demonstrating that housing construction is experiencing a slow pace during the pandemic.
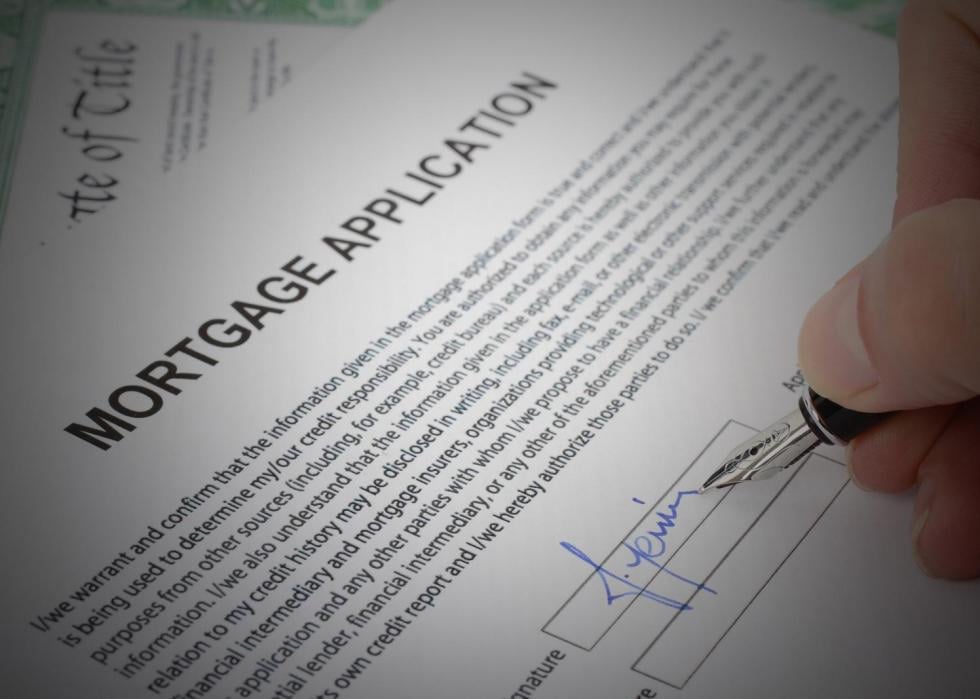
Mortgage applications
- Year-over-year purchase index (week ending May 29, 2020): +18%
- Year-over-year refinance index (week ending May 29, 2020): +137%
The refinance index measures the number of refinance applications submitted in a given week, while the purchase index measures applications for new home loan applications, according to Julia Kagan of Investopedia. These two statistics give people a sense of real estate activity. The figures from the week ending May 29, 2020, suggest that homebuyers have been returning to the real estate market and may offset declines from earlier in the season, according to Joel Kan of the Mortgage Bankers Association.

Foreclosures
- Year over year pre-foreclosure filings (April 2020): -70.9%
- Year over year auction foreclosure filings (April 2020): -76.8%
- Year over year bank-owned foreclosure filings (April 2020): -76.2%
Many states implemented bans on evictions and foreclosures to help people who experienced financial difficulties during the pandemic. As a result, home foreclosures are “in a holding pattern,” according to Megan Henney of FOXBusiness.
GDP growth
- GDP growth rate (Q1 2020): -5.0%
- Atlanta Fed GDPNow estimate (Q2 2020): -52.8%
The rate at which gross domestic product grows is one of the key indicators used to measure economic activity. With the Q1 GDP growth rate down 5%, the U.S. may experience an even sharper decline in Q2 and enter a recession. This prediction is further underscored by the Atlanta Fed GDPNow estimate of a 53% contraction this quarter.
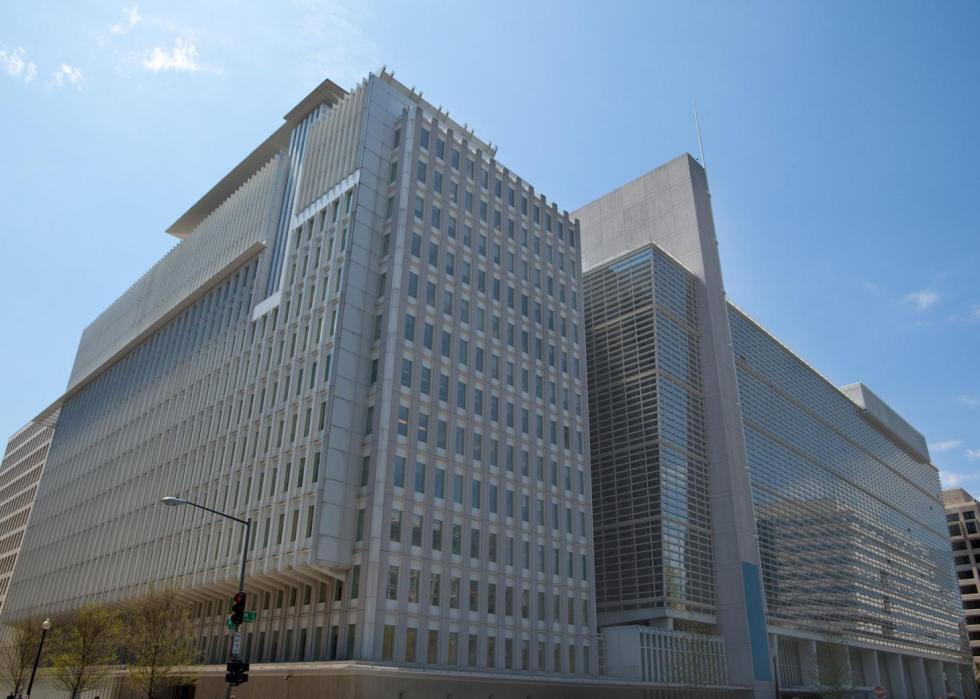
Government debt to GDP
- Total public debt as percent of GDP (4th quarter 2019): 106.8%
This indicator looks at the ratio of the nation’s public debt compared with its gross domestic product. It hit 106.8% at the end of 2019. The World Bank warns that a debt-to-GDP ratio of more than 77% for an ongoing period of time may slow economic growth.
[Pictured: World Bank headquarters in Northside Buiilding in Washington D.C.]
Treasury yields
- 10-year yield: 0.69%
- 1 month change in yield: +0.01%
- 1 year change in yield: -2.04%
The Treasury yield measures how much the U.S. government pays in interest to borrow money, and often reflects investors’ sentiment about the economy. Generally, the higher the Treasury yield, the better they feel about the future of the economy, according to James Chen of Investopedia. Treasury yields down more than 2% from a year ago may indicate a negative outlook from investors, compared with how they felt in 2019.
Treasury yield curve
- 3-month yield (as of June 2, 2020): 0.14%
- 6-month yield: 0.16%
- 1-year yield: 0.15%
- 5-year yield: 0.32%
- 10-year yield: 0.69%
- 30-year yield: 1.49%
Like Treasury yields, this economic indicator can be an indication of investors’ outlook on where the economy is headed. These numbers reflect that the economic outlook may be stabilizing and that traders expect the Federal Reserve to implement relatively less aggressive interventions in the government debt market, according to Colby Smith of The Financial Times.

Muni / treasury yield spread
- 10-year AAA muni bond yield relative to 10-year Treasury: 125%
- Previous 4-year average: 86%
Muni-treasury ratio compares the yields of municipal bonds with those of U.S. Treasuries. The measurement helps investors assess how valuable municipal bonds are at a point in time. After seeing a major spike shortly after the coronavirus hit the U.S., this economic indicator appears to be coming back down toward more-typical levels.

Corporate-treasury yield spread
- Moody's seasoned Baa corporate bond yield relative to yield on 10-Year Treasury constant maturity (as of June 1, 2020): 3.11%
- February 2020 average spread: 2.11%
This economic indicator explains the difference between Baa corporate bond yields and 10-year Treasury Notes. While it saw a spike in early march, the figure is nowhere near where it was during the Great Recession. It does, however, reflect the effect that COVID-19 has had on customer behavior and supply chains, and ultimately the debt risk of large corporations, according to Essex Financial Group.
Fed rate
- Effective federal funds rate: 0.05%
The federal funds rate is that interest rate at which commercial banks lend and borrow money to each other. The lower it is, the lower the interest rate banks can charge customers and businesses for loans. It’s currently hovering just above 0%.
[Pictured: The Federal Reserve Building.]
Bank prime lending rate
- Prime lending rate (April 2020): 3.25%
- Change since February 2020: -3.5%
The prime lending rate measures the average interest commercial banks charge companies on short-term loans. With a 3.5% rate reduction from February 2020, creditworthy businesses may be able to borrow money at a lower cost.
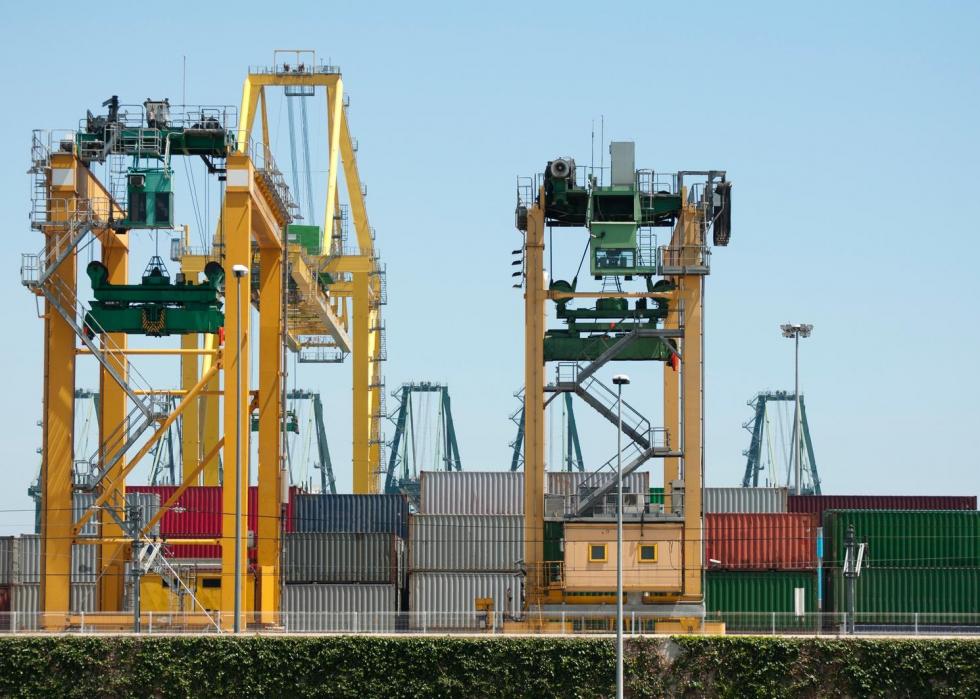
Current account
- Current account (4th quarter 2019): $109.8 billion
- Change from prior quarter: -$15.6 billion
The current account deficit, or the measurement of how much more the country spent on imports than receiving from exports, narrowed late last year as a result of the U.S. trade war with China. It was the biggest drop in the value of imported goods since 2009.

Consumer debt
- Total household debt increase (Q1 2020): $155 billion
- Change from prior quarter: +1.1%
Total household debt grew just over 1% from Q4 2019 to Q1 2020, largely due to an increase in mortgage balances and a fall in credit card balances. The increase in household debt may limit consumers’ ability to shop and potentially slow the economic recovery after the pandemic, according to economist Ed Dolan of Marker.

Consumer sentiment
- Index of consumer sentiment (May 2020): 72.3
- Year-over-year change in sentiment: -27.7%
Consumer sentiment aims to quantify the outlook that consumers have on their own financial situation, as well as how they expect the economy to perform over the near and long term. With many consumers having been hit with layoffs or reduced hours during the pandemic, as well as inflation causing prices to rise, consumer sentiment has fallen by 27.7% year over year.

Consumer spending
- Monthly consumer spending (April 2020): -13.6%
The value of goods and services Americans purchased in April fell 13.6%. This was largely led by a drop in spending on food and drinks, as well as on healthcare, food services, and accommodations, while businesses were shut down.

Retail sales
- Total monthly sales (April 2020): -16.4%
- Clothing and clothing accessories sales (April 2020): -89.3%
Retail sales took a major dip in April 2020, largely driven by the nearly 90% plummet in sales of clothing and accessories. With many retail stores closed during the pandemic and people holding off on unnecessary spending, retail sales are forecast to decline by more than 10% this year—a steeper drop than what was seen at the beginning of the Great Recession—according to Telsey Advisory Group.
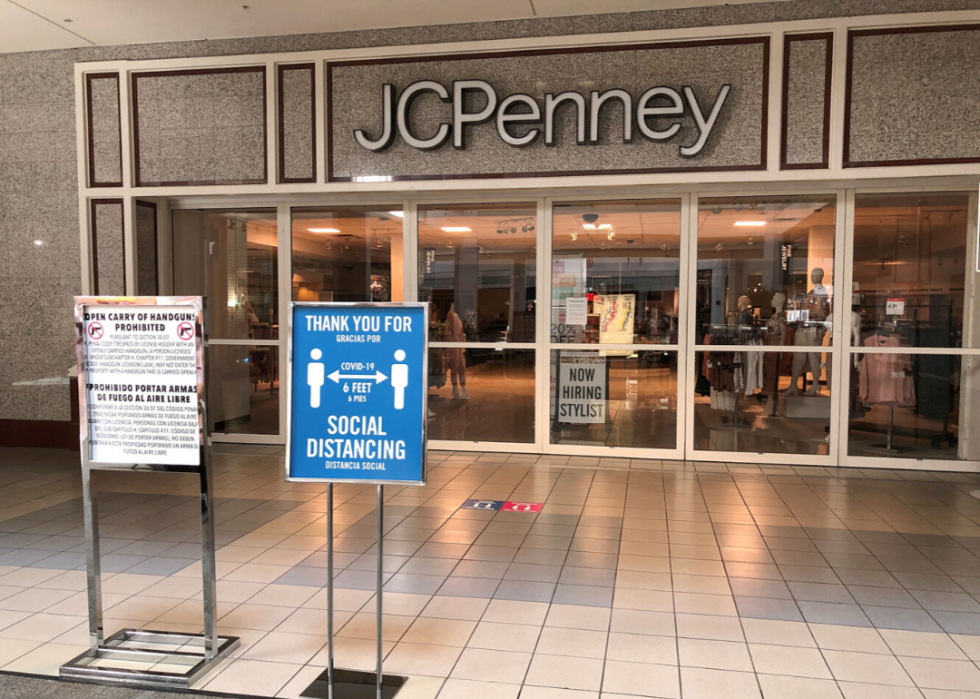
Bankruptcies - business
- Business bankruptcy cases commenced (March 2020): 1,859
- Change from February 2020: -136
The coronavirus has put companies under a lot of financial pressure, with many facing shutdowns and lower consumer spending. But despite these circumstances, the number of business bankruptcy cases filed in March and April were relatively low, potentially indicating that the government’s assistance to companies during the pandemic is paying off.
[pictured: JCPenney store in Music City Mall in Lewisville, Texas. JCPenney filed for bankruptcy protection in May due to COVID-19.]
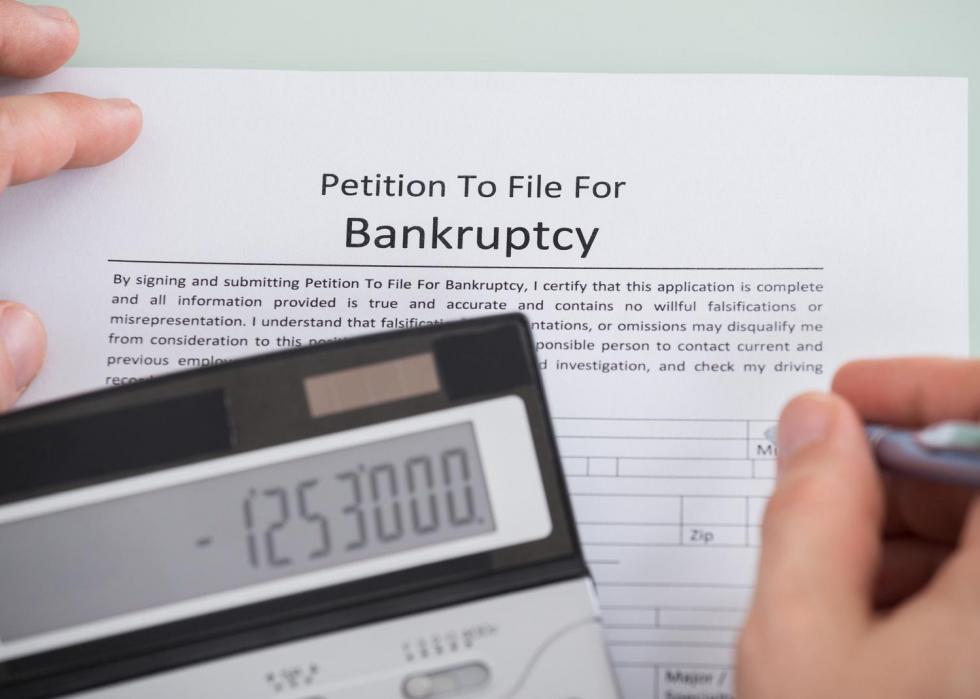
Bankruptcies - non business
- Non-business bankruptcy cases commenced (March 2020): 62,304
- Change from previous month: -6,873
Nonbusiness bankruptcy cases, which includes consumer filings, took a sharp fall in March 2020. This may be attributed to shelter-in-place orders across the country, not necessarily because consumers don’t need bankruptcy protection, according to Paige Maria Skiba, Dalié Jiménez, Michelle McKinnon Miller, Pamela Foohey, and Sara Sternberg Greene of The National Interest.

Manufacturing production
- Industrial production manufacturing index (April 2020): 86.4
- Change since February 2020: -19.7
The production manufacturing index measures the real output in the manufacturing industry. It took a nearly 20-point dive from February to April, as COVID-19 prevention measures forced many factories to reduce output or cease operations altogether.

Manufacturing PMI
- Manufacturing purchasing managers index (May 2020): 43.1%
- Change since February 2020: -7.0%
This economic index gives a sense of the direction of economic trends in manufacturing, and whether purchasing managers are expanding, holding, or cutting back. The change from February to May 2020 indicates that production, employment, and new orders have contracted during the pandemic.

Factory orders
- Monthly manufactured goods, new orders (April 2020): -13.0%
New orders on manufactured goods have fallen in three of the first four months of 2020, and saw a decrease of $57.5 billion from March to April. It reflects an overall contraction in the manufacturing industry and ongoing financial damage from the public health crisis.

Car production
- Monthly car production (March 2020): 148,800 cars
- Change since February 2020: -72,800 cars
The output of cars fell by nearly 73,000 vehicles from February to March 2020. Many automakers closed their factories in March as a response to the pandemic.

Vehicle sales
- Monthly vehicle sales (April 2020): 8.8 million
- Change since February 2020: -8.4 million
In line with a drop in monthly car production, monthly vehicle sales also tumbled by 8.4 million cars from February to April 2020. Auto makers are a major contributor to the economy, and a major drop in car sales could indicate that a recession is looming.
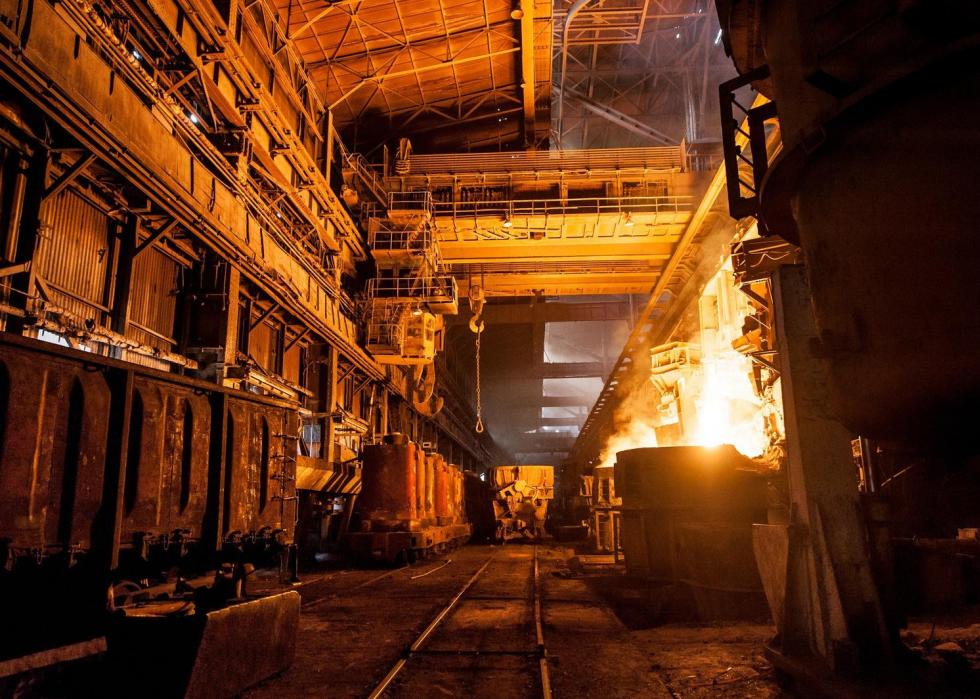
Steel production
- Raw steel production (week ending May 30, 2020): 1.2 million net tons (53.8% capacity utilization rate)
- Year-over-year change in raw steel production: -0.7 million net tons (-27.0% capacity utilization rate)
Steel is an important material in engineering, the automotive industry, and construction. A decline in raw steel production indicates a lower demand in other sectors, giving clues as to how the overall economy is performing.
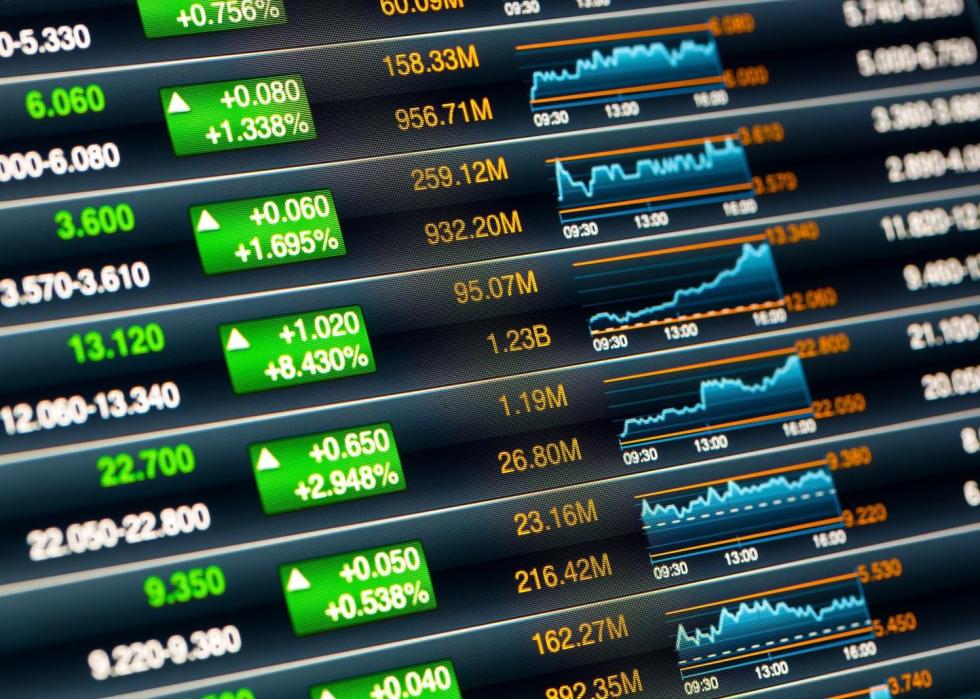
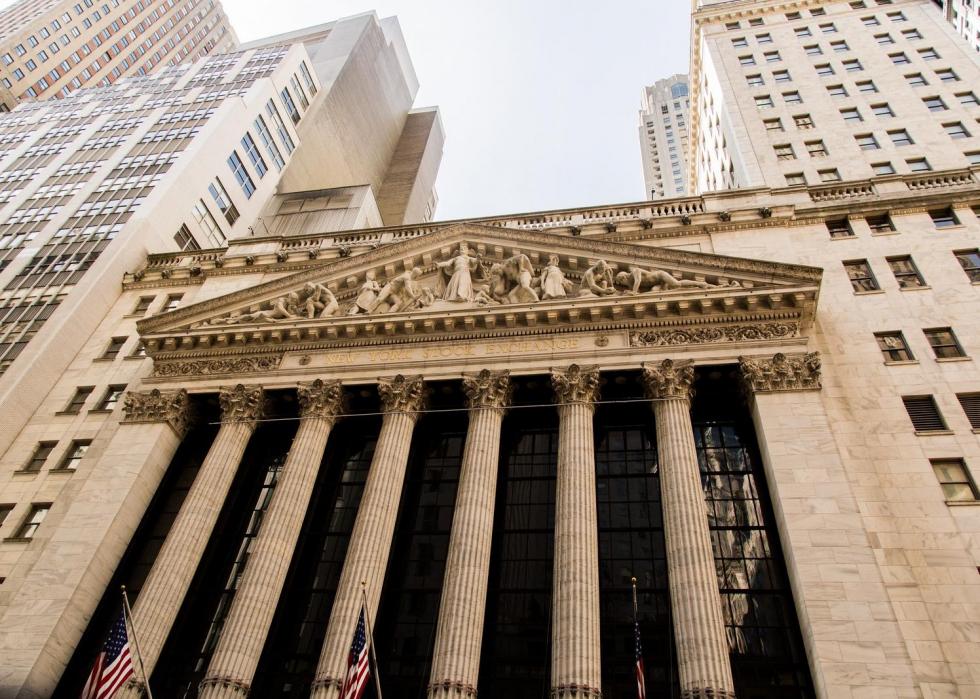
S&P 500
- Year-to-date return (as of June 1, 2020): -5.0%
- 1-year return: +13.6%
The Standard & Poor’s 500 is a stock market index measuring the stocks of the 500 largest publicly-traded companies in the U.S. It offers a broad perspective of the overall performance of the economy in the U.S. While 1-year returns were up 13.6%, the year-to-date return dropped 5% amid the pandemic.

Oil price
- WTI nearest futures price (as of June 1, 2020): $36.70
- Change since January 1, 2020: -$24.36
The nearest futures price of West Texas Intermediate crude oil, a benchmark in oil pricing, fell by more than $24 between January and June. It’s part of an overall historic collapse in crude oil prices, due to extremely low demand while the pandemic paralyzed economies around the world.

Gasoline price
- AAA average national gas price (as of June 1, 2020): $1.98
- Year over year change: -$0.83
The average gas prices have fallen during the pandemic, in line with the drop in crude oil prices. While it’s still unclear how exactly COVID-19 has impacted the production and consumption of gas, according to Brett Campbell of The Daily Leader, demand for gasoline likely fell while stay-at-home orders were in place.

Oil production
- Weekly oil production (week ending May 22, 2019): 11.4 million barrels per day
- Change since February 28, 2020: -1.7 million barrels per day
Oil production has continued to drop since the coronavirus outbreak in the U.S. Oil production is considered a driver of economic growth, and changes in this economic indicator may increase the country’s vulnerability to economic shocks, according to Andrew Beattie of Investopedia.
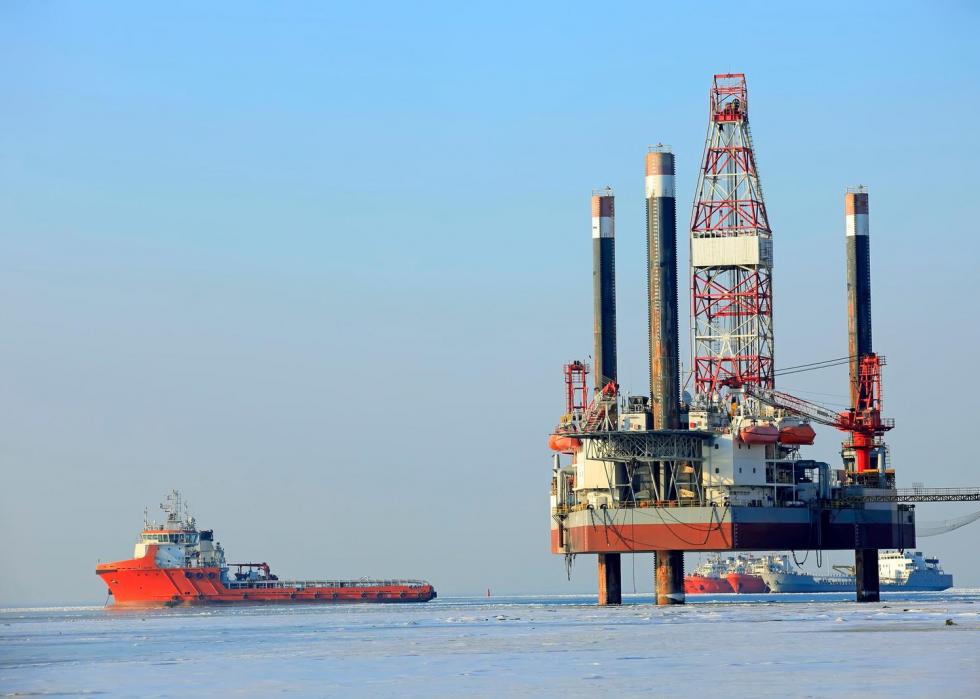
Oil rigs
- Rig count (as of May 29, 2020): 301
- Year over year change in oil rig count: -683
The count of oil rigs is an indicator of how the drilling industry and businesses that supply it are performing, as well as the rise or fall in demand for products related to drilling. Rig counts are down by 683 between May 2020 and May 2019. Energy companies were forced to cease some oil-field operations during the pandemic, which is likely why the rig count dropped.

Gold price
- Gold spot price (as of June 1, 2020): $1,727.45 per troy ounce
- Year-to-date return: +14.4% (compared to -5.0% for S&P 500)
Gold tends to be seen by investors as an inflation hedge. Central banks are often responsible for the biggest changes in the price of gold. The high price of gold in recent months may indicate that central banks may be holding onto their reserves amid economic woes from COVID-19.
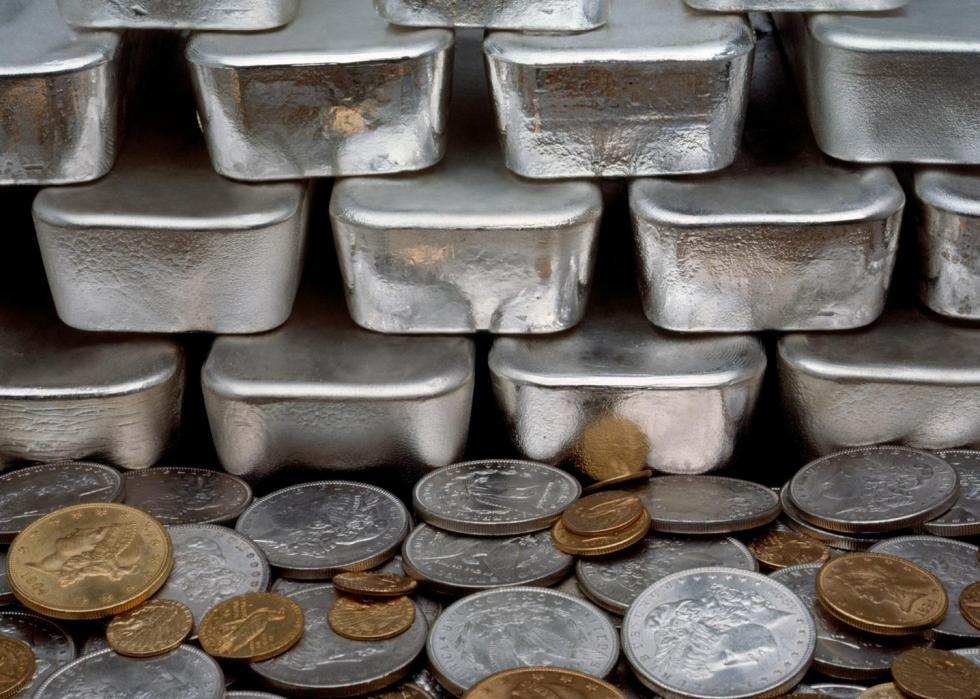
Silver price
- Silver spot price (as of June 1, 2020): $18.06 per troy ounce
- Year to date return: +0.2% (compared to -5.0% for S&P 500)
The silver spot price is the current cost of silver and can be affected by a variety of factors, including supply and demand, politics, and physical mines—all of which have been impacted by the pandemic. With that said, the silver spot price has seen only a modest increase over the last year.

Copper price
- Copper nearest futures price (as of June 1, 2020): $2.47 per pound
- Change since January 1, 2020: -$0.36
The price of copper has seen a decline over the last few months. Since copper is used in the construction of commercial buildings and residences, it may indicate that demand has fallen in those sectors.
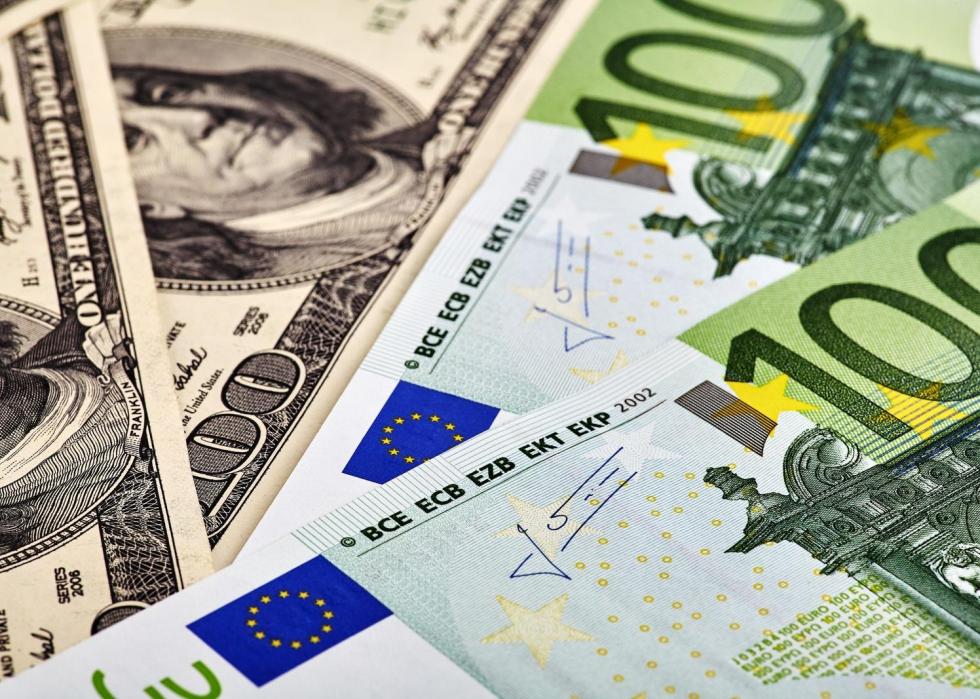
USD-EUR
- USD-EUR exchange rate (as of June 1, 2020): 0.8954
Changes to interest rates made by global central banks can affect the USD-EUR exchange rate and ultimately the foreign-exchange market. The dollar has taken a hit compared with the euro during the pandemic.

Airline passengers
- Year-over-year monthly airline passengers (March 2020): -51.5%
The pandemic has created the largest year-to-year decrease in airline passengers in history, with a 51.5% decline. The airline industry is responsible for $1.7 trillion in the economy and employs more than 10 million Americans, so a marked decline in its business could make a big impact.

Apple mobility index
- Change in routing requests since January 13, 2020 (as of May 31, 2020): -2%
The Apple mobility index tracks the relative volume of requests for directions on Apple Maps, to get a sense of how much people are moving around to do things like travel, shop, dine, and go to work. The index dropped significantly in March and April, while many locations were shut down, but it had climbed close to the baseline date of Jan. 13, 2020 at the end of May.

Business foot traffic
- Year-over-year business foot traffic (as of May 28, 2020): -30%
Foot traffic to businesses like fast food restaurants, grocery stores, airports, and movie theaters was still down by 30% on May 28, 2020, compared to the year before. The data shows how the coronavirus is making an impact on people visiting businesses.

Restaurant bookings
- Year-over-year restaurant bookings (as of May 31, 2020): -83.0%
With dining rooms at many restaurants across the country closed, it’s no surprise that reservations have taken a nosedive. They were down 83% at the end of May. The loss in business has cost the restaurant industry 59 million jobs.

Box office revenue
- Weekly box office (May 22-28, 2020): $335,000
Box offices brought in just $335,000 in revenue during the week of May 22-28, with theaters closed. That’s just a fraction of the nearly $190 million box office revenue from the same week in 2019.

Public transit ridership
- Demand compared to normal (as of June 1, 2020): -62%
Public transit ridership was down 62% compared to normal as of June 1, 2020. Many people have started working from home during the pandemic, according to a survey by CNBC/Change Research from April, which eliminates their need to take buses and trains to the office.