54 American cities with dangerous ozone conditions
54 American cities with dangerous ozone conditions
More than 25% of the population in the United States—about 83 million people—are currently exposed to air quality thresholds categorized as "unhealthy" by the Environmental Protection Agency, according to a February 2024 report from First Street Foundation, a non-profit that analyzes climate risk. That number is expected to grow to an estimated 125 million Americans by 2054.
Part of the problem is the increasing occurrence of wildfires. In the summer of 2023, uncontrollable flames scorched Canada, not only wreaking havoc on our neighbor to the north but also leading substantial swaths of the U.S. to experience worse air quality than the country had seen in years.
Even when Canadian wildfires aren't raging, many parts of the U.S. have dangerous air quality conditions and that's due to ozone or smog, an invisible gas with a big impact. Ozone pollution, created when sunlight hits gases produced by emitters like cars, factories, and fires, can cause serious damage to human health. It is poisonous to our lungs and can cause asthma, irritation, inflammation of the airway, and more. It is especially damaging to older people and children. Ozone pollution is often concentrated near lower-income communities. Hot places and places with few public transit options also have more ozone pollution. Clean, breathable air is necessary for survival, but many people in areas with high ozone pollution struggle with the effects. Areas with high ozone pollution often have higher rates of asthma, and sometimes even shorter life expectancy and higher rates of birth defects.
The United States has made huge strides with ozone pollution since the establishment of the Clean Air Act in 1963, but in recent years, ozone has inched back up, especially in warmer regions. That is partially due to climate change, which is making summers hotter and therefore increasing sunlight that can combine with gases to produce ground-level ozone.
To examine ozone conditions in the U.S., Stacker consulted Climate Central, a nonprofit news organization that compiles research and helps other news outlets report on climate change. In their July 2019 air quality research brief, Climate Central researchers identified 54 cities with dangerous ozone conditions. These cities were identified because they either had a large number of unhealthy ozone days over the past four years in terms of pure count (greater than 20 days total), a continuous increase in unhealthy ozone days over at least three of the past four years, or more unhealthy ozone days in a single recent year (2015 to 2018) than their past (2000 to 2014) average. Stacker's story lists these 54 cities according to their annual average of unhealthy ozone days over the past four years (2015 to 2018), with ties broken by the number of unhealthy ozone days these cities faced in 2018.
#54. Portland, OR
- Annual average of unhealthy ozone days in 2015-2018: 1
- Unhealthy ozone days in 2018: 2
- Total unhealthy ozone days in 2015-2018: 4
- Annual average of unhealthy ozone days in 2000-2014: 0.5 (#54 highest)
Although Portland does not have a significant number of unhealthy days, it has increased to two a year; in 2014, the city averaged only half a day a year. Like much of the West, Portland's air quality is significantly impacted by wildfire, which increases ozone as well as particulate matter in the air.
#53. Terre Haute, IN (tie)
- Annual average of unhealthy ozone days in 2015-2018: 1.5
- Unhealthy ozone days in 2018: 3
- Total unhealthy ozone days in 2015-2018: 6
- Annual average of unhealthy ozone days in 2000-2014: 8.2 (#39 highest)
The Midwest has made major progress on air quality, but during the Trump Administration emissions have started to crawl back up. Much of Indiana had an upward trend in ozone days in 2018, with Terre Haute experiencing the worst conditions in the state.
#53. Sioux Falls, SD (tie)
- Annual average of unhealthy ozone days in 2015-2018: 1.5
- Unhealthy ozone days in 2018: 3
- Total unhealthy ozone days in 2015-2018: 6
- Annual average of unhealthy ozone days in 2000-2014: 1.1 (#53 highest)
Air quality in South Dakota, while generally good, has suffered due to oil and gas activities in the region. Wildfire smoke also causes some issues for SD. Although the state does not suffer wildfires generally, smoke blows in from other states.
#51. Spokane, WA
- Annual average of unhealthy ozone days in 2015-2018: 1.5
- Unhealthy ozone days in 2018: 4
- Total unhealthy ozone days in 2015-2018: 6
- Annual average of unhealthy ozone days in 2000-2014: 2.1 (#51 highest)
Spokane becomes blanketed in smoke every summer from wildfires in Canada and in other parts of the Northwest. In August 2018, the city had the worst air quality in the nation for a day. City officials encourage residents to keep pets inside, wear masks, and limit exposure, but the lack of air quality is a significant public health crisis.
#50. Miami, FL
- Annual average of unhealthy ozone days in 2015-2018: 1.75
- Unhealthy ozone days in 2018: 2
- Total unhealthy ozone days in 2015-2018: 7
- Annual average of unhealthy ozone days in 2000-2014: 4.0 (#50 highest)
Air quality is not the largest climate justice issue in Florida — sea level rise is the more common issue discussed in the region. But smog is still an issue in Miami, due in large part to vehicles, cruise ships, and other transport emissions.
#49. Peoria, IL
- Annual average of unhealthy ozone days in 2015-2018: 2
- Unhealthy ozone days in 2018: 3
- Total unhealthy ozone days in 2015-2018: 8
- Annual average of unhealthy ozone days in 2000-2014: 7.1 (#42 highest)
Peoria County has a coal plant, the E.D Edwards plant, which has polluted its air. Environmental groups like the Sierra Club had been fighting to close the plant since 2013, and a federal judge ordered the plant to do so by the end of 2022 and provide funding for green jobs in the area.
#48. Rochester, MN
- Annual average of unhealthy ozone days in 2015-2018: 2.25
- Unhealthy ozone days in 2018: 4
- Total unhealthy ozone days in 2015-2018: 9
- Annual average of unhealthy ozone days in 2000-2014: 6.9 (#43 highest)
Olmsted County, the county where Rochester is located, has one of the dirtiest trash incinerators in the country. Although the facility has improved, it is a large source of emissions in the surrounding region.
#47. Tampa Area, FL
- Annual average of unhealthy ozone days in 2015-2018: 2.75
- Unhealthy ozone days in 2018: 4
- Total unhealthy ozone days in 2015-2018: 11
- Annual average of unhealthy ozone days in 2000-2014: 16.3 (#29 highest)
Tampa has fairly good air quality, compared to many other urban areas. However, Tampa suffers from poor transit infrastructure, and vehicle emissions have impacted the area's air, which was ruled the worst in the state of Florida in 2015.
#46. Colorado Springs, CO
- Annual average of unhealthy ozone days in 2015-2018: 3
- Unhealthy ozone days in 2018: 7
- Total unhealthy ozone days in 2015-2018: 12
- Annual average of unhealthy ozone days in 2000-2014: 8 (#40 highest)
Oil and gas activity has increased significantly in Colorado in the last 10 years, which has hurt the state's air quality. Wildfires and vehicle emissions have also increased ozone issues in Colorado.
#45. Newark, NJ
- Annual average of unhealthy ozone days in 2015-2018: 3.25
- Unhealthy ozone days in 2018: 4
- Total unhealthy ozone days in 2015-2018: 13
- Annual average of unhealthy ozone days in 2000-2014: 4.5 (#47 highest)
An incinerator in the Ironbound neighborhood of Newark is under investigation by several environmental groups because of the pink smoke (an indicator of iodine used in the medical industry) that it releases into the air. The Ironbound neighborhood is a working-class, diverse neighborhood that is one of the most polluted in the nation. The incinerator burns nearly 3,000 pounds of trash per day, and residents are concerned that the facility is releasing other harmful medical pollutants into the air.
#44. Medford, OR
- Annual average of unhealthy ozone days in 2015-2018: 3.25
- Unhealthy ozone days in 2018: 6
- Total unhealthy ozone days in 2015-2018: 13
- Annual average of unhealthy ozone days in 2000-2014: 1.7 (#52 highest)
Wildfires have left the Medford region of Oregon with extremely polluted air. Although wildfires are known for producing particulate pollution, they also increase ozone levels in the air.
#43. Denver, CO
- Annual average of unhealthy ozone days in 2015-2018: 3.5
- Unhealthy ozone days in 2018: 7
- Total unhealthy ozone days in 2015-2018: 14
- Annual average of unhealthy ozone days in 2000-2014: 6.2 (#46 highest)
Denver has become the epicenter of debates about fracking in Colorado, as oil and gas activity has caused increased air pollution in the region. Local and national environmental groups are fighting to curb fracking permits, but in the meantime, the Denver region has a fair number of hazy days.
#42. Tucson, AZ
- Annual average of unhealthy ozone days in 2015-2018: 3.75
- Unhealthy ozone days in 2018: 7
- Total unhealthy ozone days in 2015-2018: 15
- Annual average of unhealthy ozone days in 2000-2014: 10.9 (#36 highest)
Hot, sunny places like Arizona are more prone to ozone pollution because certain compounds produce the gas when combined with heat. In Tucson, the largest polluters are cars and trucks; in 2018 the city violated federal ozone standards for the first time.
#41. Oklahoma City, OK
- Annual average of unhealthy ozone days in 2015-2018: 4.5
- Unhealthy ozone days in 2018: 9
- Total unhealthy ozone days in 2015-2018: 18
- Annual average of unhealthy ozone days in 2000-2014: 21.9 (#21 highest)
After years of making progress on air quality, Oklahoma's air quality has dipped once again. Experts think this is largely due to the wildfires and droughts in the region.
#40. Milwaukee, WI
- Annual average of unhealthy ozone days in 2015-2018: 5
- Unhealthy ozone days in 2018: 5
- Total unhealthy ozone days in 2015-2018: 20
- Annual average of unhealthy ozone days in 2000-2014: 13.0 (#34 highest)
Parts of Milwaukee have received an "F" grade for air quality from the American Lung Association (ALA) for high levels of summer smog. Unfortunately, air pollution may continue to worsen as a large manufacturing plant is planned for the region.
#39. Washington D.C. (tie)
- Annual average of unhealthy ozone days in 2015-2018: 5
- Unhealthy ozone days in 2018: 6
- Total unhealthy ozone days in 2015-2018: 20
- Annual average of unhealthy ozone days in 2000-2014: 20.9 (#24 highest)
D.C. also received a failing grade on ozone from the ALA. The hotter summers the region has experienced are likely contributing to the city's increased air pollution.
#39. Austin, TX (tie)
- Annual average of unhealthy ozone days in 2015-2018: 5
- Unhealthy ozone days in 2018: 6
- Total unhealthy ozone days in 2015-2018: 20
- Annual average of unhealthy ozone days in 2000-2014: 13.9 (#33 highest)
As Austin has grown, its air quality has gotten worse. The city doesn't have a strong enough public transit infrastructure for people to avoid driving, and tailpipe emissions are the largest source of its ozone problem.
#37. South Bend, IN
- Annual average of unhealthy ozone days in 2015-2018: 5
- Unhealthy ozone days in 2018: 7
- Total unhealthy ozone days in 2015-2018: 20
- Annual average of unhealthy ozone days in 2000-2014: 12.8 (#35 highest)
Although air quality seems to be improving in Indiana, it there is still much work to be done. The U.S. News and World Report's "Best States" ranking puts Indiana at 48th for quality of life, partially because of its poor air quality and pollution issues.
#36. Providence, RI
- Annual average of unhealthy ozone days in 2015-2018: 5
- Unhealthy ozone days in 2018: 8
- Total unhealthy ozone days in 2015-2018: 20
- Annual average of unhealthy ozone days in 2000-2014: 10.9 (#37 highest)
Providence is one of New England's most polluted cities. The culprits are the city's industrial waterfront, a natural gas plant, and the highway I-95 which cuts through the city.
#35. New York City, NY
- Annual average of unhealthy ozone days in 2015-2018: 5
- Unhealthy ozone days in 2018: 10
- Total unhealthy ozone days in 2015-2018: 20
- Annual average of unhealthy ozone days in 2000-2014: 6.5 (#45 highest)
Large cities have smog issues, and New York is no exception. NYC ranks well on particulate pollution—the pollution commonly produced from wood burning and wildfires—but very poorly on ozone.
#34. Memphis, TN (tie)
- Annual average of unhealthy ozone days in 2015-2018: 5.25
- Unhealthy ozone days in 2018: 8
- Total unhealthy ozone days in 2015-2018: 21
- Annual average of unhealthy ozone days in 2000-2014: 25.0 (#17 highest)
Like New York, Memphis has made major progress on particulate pollution, but its ozone levels are rising. The city received an F-rating from the American Lung Association.
#34. Baltimore, MD (tie)
- Annual average of unhealthy ozone days in 2015-2018: 5.25
- Unhealthy ozone days in 2018: 8
- Total unhealthy ozone days in 2015-2018: 21
- Annual average of unhealthy ozone days in 2000-2014: 4.5 (#48 highest)
Maryland has very polluted air, and 20% of Baltimore's children have been diagnosed with asthma. The problem is multi-faceted but the state's coal plants are a major factor.
#32. Boise, ID
- Annual average of unhealthy ozone days in 2015-2018: 5.5
- Unhealthy ozone days in 2018: 2
- Total unhealthy ozone days in 2015-2018: 22
- Annual average of unhealthy ozone days in 2000-2014: 6.6 (#44 highest)
Idaho is experiencing a major dip in air quality. Like many Western states, wildfires are to blame. Idaho now ranks in the top-25 most polluted parts of the country.
#31. Charlotte, NC
- Annual average of unhealthy ozone days in 2015-2018: 5.75
- Unhealthy ozone days in 2018: 5
- Total unhealthy ozone days in 2015-2018: 23
- Annual average of unhealthy ozone days in 2000-2014: 31.5 (#10 highest)
Charlotte has come a long way on particulate pollution, but ozone is still a major issue in the city. The region's hot summers are likely exacerbating the issue.
#30. Seattle-Tacoma, WA
- Annual average of unhealthy ozone days in 2015-2018: 5.75
- Unhealthy ozone days in 2018: 6
- Total unhealthy ozone days in 2015-2018: 23
- Annual average of unhealthy ozone days in 2000-2014: 4.3 (#49 highest)
With an exploding population and serious smoke issues stemming from wildfires, the Seattle area experiences periods of extremely poor air quality. Wildfire smoke from fires in Oregon, California, and Canada have all impacted Seattle's air quality, along with tailpipe emissions and industrial sources.
#29. Beaumont, TX
- Annual average of unhealthy ozone days in 2015-2018: 5.75
- Unhealthy ozone days in 2018: 7
- Total unhealthy ozone days in 2015-2018: 23
- Annual average of unhealthy ozone days in 2000-2014: 26.4 (#14 highest)
Like Austin, Beaumont is struggling with ozone pollution from vehicle emissions and heat. Beaumont is nearing "nonattainment" status under the Clean Air Act, meaning pollution exceeds federal standards.
#28. Albuquerque-Santa Fe, NM
- Annual average of unhealthy ozone days in 2015-2018: 5.75
- Unhealthy ozone days in 2018: 15
- Total unhealthy ozone days in 2015-2018: 23
- Annual average of unhealthy ozone days in 2000-2014: 14.4 (#31 highest)
Albuquerque is backsliding on ozone pollution as well as particulate pollution. Experts think the increase is related to heat waves.
#27. Cleveland, OH
- Annual average of unhealthy ozone days in 2015-2018: 6
- Unhealthy ozone days in 2018: 11
- Total unhealthy ozone days in 2015-2018: 24
- Annual average of unhealthy ozone days in 2000-2014: 15.9 (#30 highest)
Cleveland's air is impacted by industry and extreme heat, and the result is high ozone levels. The city's high pollution levels can make it especially difficult for children and elderly folks to breathe easy.
#26. Detroit, MI
- Annual average of unhealthy ozone days in 2015-2018: 6.25
- Unhealthy ozone days in 2018: 7
- Total unhealthy ozone days in 2015-2018: 25
- Annual average of unhealthy ozone days in 2000-2014: 14.0 (#32 highest)
Detroit has long been an industrial city, and that means pollutants in the air. According to the Detroit Journalism Cooperative, there are over 150 sites in the southwest part of the city alone that release pollutants such as nitrous oxide and ozone.
#25. Yuma, AZ-El Centro, CA
- Annual average of unhealthy ozone days in 2015-2018: 6.75
- Unhealthy ozone days in 2018: 6
- Total unhealthy ozone days in 2015-2018: 27
- Annual average of unhealthy ozone days in 2000-2014: 8.3 (#38 highest)
Most of the country's most polluted cities are in California, partially due to year-round heat and sunshine. El Centro is the eighth most polluted city in the country.
Note: Yuma, AZ and El Centro, CA are grouped together as one city because they are in the same Nielson media market (i.e. these communities are grouped together for weather forecasts).
#24. Baton Rouge, LA
- Annual average of unhealthy ozone days in 2015-2018: 7
- Unhealthy ozone days in 2018: 9
- Total unhealthy ozone days in 2015-2018: 28
- Annual average of unhealthy ozone days in 2000-2014: 25.1 (#16 highest)
Baton Rouge is compliant with federal air quality standards, which it has not always been in the past. However, its ozone levels remain high, partially due to power plants and other industrial activity.
#23. Cincinnati, OH
- Annual average of unhealthy ozone days in 2015-2018: 7.5
- Unhealthy ozone days in 2018: 8
- Total unhealthy ozone days in 2015-2018: 30
- Annual average of unhealthy ozone days in 2000-2014: 26.9 (#13 highest)
Cincinnati struggles with air pollution, especially in the summer. Major culprits include coal-fired power plants and vehicle emissions.
#22. Wilmington, DE
- Annual average of unhealthy ozone days in 2015-2018: 7.75
- Unhealthy ozone days in 2018: 6
- Total unhealthy ozone days in 2015-2018: 31
- Annual average of unhealthy ozone days in 2000-2014: 22 (#20 highest)
Delaware struggles with air pollution blown in from other states, like Pennsylvania, that are high energy producers. The state has petitioned the EPA several times for relief from this pollution through a clause called "The Good Neighbor Provision."
#21. Atlanta, GA
- Annual average of unhealthy ozone days in 2015-2018: 8
- Unhealthy ozone days in 2018: 4
- Total unhealthy ozone days in 2015-2018: 32
- Annual average of unhealthy ozone days in 2000-2014: 25.7 (#15 highest)
Atlanta has the second-highest rate of pollution from vehicles in the country. Tailpipe emissions are its main source of ozone, which contributes to the high rate of asthma in Georgia (nearly double the national average).
#20. Pittsburgh, PA
- Annual average of unhealthy ozone days in 2015-2018: 8.25
- Unhealthy ozone days in 2018: 8
- Total unhealthy ozone days in 2015-2018: 33
- Annual average of unhealthy ozone days in 2000-2014: 24.9 (#18 highest)
Pittsburgh has been an industrial center for much of its history, especially as a steel production center. That has left a legacy of pollution the city is trying to break, but factories still contribute to the area's poor air quality.
#19. Louisville, KY
- Annual average of unhealthy ozone days in 2015-2018: 8.5
- Unhealthy ozone days in 2018: 8
- Total unhealthy ozone days in 2015-2018: 34
- Annual average of unhealthy ozone days in 2000-2014: 21.4 (#23 highest)
Louisville is both densely populated and located in a valley which is a dangerous combination for air quality. Smog gathers in the city and settles there; as a result, the city has had air quality issues for years.
#18. San Antonio, TX
- Annual average of unhealthy ozone days in 2015-2018: 8.5
- Unhealthy ozone days in 2018: 10
- Total unhealthy ozone days in 2015-2018: 34
- Annual average of unhealthy ozone days in 2000-2014: 19.2 (#25 highest)
Although San Antonio produces its own ozone, most of its pollution comes from other places. Because of the city's geographic location, wind currents carry pollution from other parts of the U.S. and even other countries.
#17. Dallas-Ft. Worth, TX
- Annual average of unhealthy ozone days in 2015-2018: 8.5
- Unhealthy ozone days in 2018: 14
- Total unhealthy ozone days in 2015-2018: 34
- Annual average of unhealthy ozone days in 2000-2014: 30.7 (#11 highest)
Dallas has been one of the more polluted cities in the U.S. for years. Heat is exacerbating the problem and making it more difficult for the city to keep ozone levels down.
#16. El Paso, TX
- Annual average of unhealthy ozone days in 2015-2018: 9.25
- Unhealthy ozone days in 2018: 14
- Total unhealthy ozone days in 2015-2018: 37
- Annual average of unhealthy ozone days in 2000-2014: 18.2 (#27 highest)
Industrial facilities in the El Paso region released more than 23,000 pounds of pollution into the air in 2017 without authorization. Advocates are calling for the state of Texas to be tougher on companies and hold them accountable for pollution.
#15. Reno, NV
- Annual average of unhealthy ozone days in 2015-2018: 9.75
- Unhealthy ozone days in 2018: 18
- Total unhealthy ozone days in 2015-2018: 39
- Annual average of unhealthy ozone days in 2000-2014: 7.1 (#41 highest)
Because it is located so close to California, Reno often gets hit by the smoke from the neighboring state's wildfires. Smokier skies mean more pollution, which the city is trying to control.
#14. Philadelphia, PA
- Annual average of unhealthy ozone days in 2015-2018: 11.25
- Unhealthy ozone days in 2018: 10
- Total unhealthy ozone days in 2015-2018: 45
- Annual average of unhealthy ozone days in 2000-2014: 24.4 (#19 highest)
Both local emissions and upwind sources contribute to Philadelphia's ozone issue. Summer heat only makes it worse. The combination is one of the worst ozone burdens in the country.
#13. Chicago, IL
- Annual average of unhealthy ozone days in 2015-2018: 14.5
- Unhealthy ozone days in 2018: 18
- Total unhealthy ozone days in 2015-2018: 58
- Annual average of unhealthy ozone days in 2000-2014: 19.1 (#26 highest)
Chicago's air is bad and getting worse. The largest culprit is vehicle emissions, combined with intense summer heat that spikes ozone pollution.
#12. Chico, CA
- Annual average of unhealthy ozone days in 2015-2018: 14.75
- Unhealthy ozone days in 2018: 20
- Total unhealthy ozone days in 2015-2018: 59
- Annual average of unhealthy ozone days in 2000-2014: 30.7 (#12 highest)
Chico suffers from poor air from wildfire smoke. The Camp Fire, the most destructive wildfire in California history, started close to Chico and left the city choking on smoke.
#11. Las Cruces, NM
- Annual average of unhealthy ozone days in 2015-2018: 15.25
- Unhealthy ozone days in 2018: 26
- Total unhealthy ozone days in 2015-2018: 61
- Annual average of unhealthy ozone days in 2000-2014: 16.6 (#28 highest)
New Mexico struggles with poor air due to both natural and unnatural sources. The state suffers from wildfires and dust storms. New Mexico is also an energy-producing state and emissions from oil and gas activities exacerbate the problem.
#10. Sacramento, CA
- Annual average of unhealthy ozone days in 2015-2018: 22.5
- Unhealthy ozone days in 2018: 19
- Total unhealthy ozone days in 2015-2018: 90
- Annual average of unhealthy ozone days in 2000-2014: 49.4 (#6 highest)
Like many other California cities, Sacramento struggles with pollution due to wildfires. But the city also has a very hot, stagnant summer, trapping emissions from cars and other vehicles.
#9. Salt Lake City, UT
- Annual average of unhealthy ozone days in 2015-2018: 23.5
- Unhealthy ozone days in 2018: 31
- Total unhealthy ozone days in 2015-2018: 94
- Annual average of unhealthy ozone days in 2000-2014: 21.7 (#22 highest)
A major contributor to Utah's poor air quality days is a unique phenomenon known as temperature inversions. That's when, rather than the atmosphere growing colder as you get higher, it actually gets warmer. It's not uncommon in Utah in the winter, when the sun is low. Pollution can double daily during an inversion period.
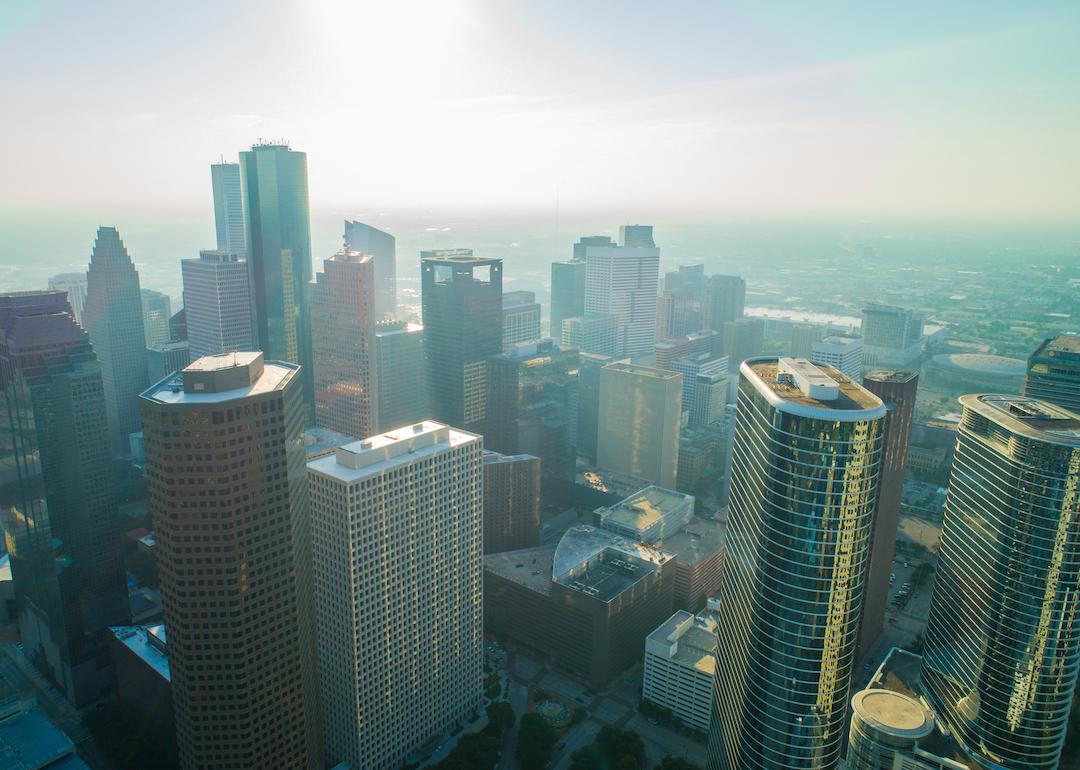
#8. Houston, TX
- Annual average of unhealthy ozone days in 2015-2018: 24.25
- Unhealthy ozone days in 2018: 25
- Total unhealthy ozone days in 2015-2018: 97
- Annual average of unhealthy ozone days in 2000-2014: 45.7 (#8 highest)
After years of progress, Houston is backsliding on ozone pollution. That is due to climate change, which is making the city hotter and increasing pollution.
#7. Las Vegas, NV
- Annual average of unhealthy ozone days in 2015-2018: 27.75
- Unhealthy ozone days in 2018: 46
- Total unhealthy ozone days in 2015-2018: 111
- Annual average of unhealthy ozone days in 2000-2014: 44.9 (#9 highest)
With a high population, very low precipitation, and very hot temperatures, Las Vegas is a recipe for ozone production, and the city's air quality illustrates the problem. Areas near power plants and other industrial production are worse than the rest of the city.
#6. Phoenix, AZ
- Annual average of unhealthy ozone days in 2015-2018: 37
- Unhealthy ozone days in 2018: 48
- Total unhealthy ozone days in 2015-2018: 148
- Annual average of unhealthy ozone days in 2000-2014: 54.8 (#5 highest)
Like Vegas, Phoenix is a big city in the middle of the desert — and that means pollution is being produced. Hot temperatures worsen ozone, and the city is largely car dependent.
#5. San Diego, CA
- Annual average of unhealthy ozone days in 2015-2018: 40.25
- Unhealthy ozone days in 2018: 30
- Total unhealthy ozone days in 2015-2018: 161
- Annual average of unhealthy ozone days in 2000-2014: 45.7 (#7 highest)
San Diego's ozone pollution has increased dramatically. Climate change is contributing, as is the city's car-dependent population.
#4. Fresno, CA
- Annual average of unhealthy ozone days in 2015-2018: 78.25
- Unhealthy ozone days in 2018: 67
- Total unhealthy ozone days in 2015-2018: 313
- Annual average of unhealthy ozone days in 2000-2014: 103.7 (#3 highest)
Fresno is one of the most polluted cities in America. It has extremely high rates of asthma and has been used as an example by environmental justice advocates for the need to reduce pollution and care for vulnerable populations. Part of what has contributed to the issue for Fresno is that it is located in a valley, which traps pollution.
#3. Bakersfield, CA
- Annual average of unhealthy ozone days in 2015-2018: 93
- Unhealthy ozone days in 2018: 96
- Total unhealthy ozone days in 2015-2018: 372
- Annual average of unhealthy ozone days in 2000-2014: 124.9 (#2 highest)
Bakersfield, near to Fresno, suffers from the same issues: Both are in a valley and therefore pollution gets trapped. There is also little public transit in the city. Bakersfield and Fresno both have large immigrant populations, and the air quality issues in the cities have called attention to the need for environmental justice for vulnerable groups.
#2. Los Angeles, CA
- Annual average of unhealthy ozone days in 2015-2018: 98.5
- Unhealthy ozone days in 2018: 90
- Total unhealthy ozone days in 2015-2018: 394
- Annual average of unhealthy ozone days in 2000-2014: 102.6 (#4 highest)
L.A. smog is infamous; the city is incredibly car-dependent and sunny year-round, which contributes to ozone issues. After decades of progress, Southern California is seeing ozone creep back up again. There was a 10% increase in smog-related deaths in the region between 2010 and 2017, according to researchers.
#1. Palm Springs, CA
- Annual average of unhealthy ozone days in 2015-2018: 112.5
- Unhealthy ozone days in 2018: 120
- Total unhealthy ozone days in 2015-2018: 450
- Annual average of unhealthy ozone days in 2000-2014: 130.0 (#1 highest)
Palm Springs has very poor air quality because of a variety of factors, including smoke from wildfires as well as vehicle emissions. Health impacts have already been seen in the residents of the Coachella valley, and regulators are considering moving the city's classification to "extreme" noncompliance with the Clean Air Act.


