What Americans have paid in taxes over the past 30 years
What Americans have paid in taxes over the past 30 years
It’s been said that there are only two certainties in life: death and taxes. Most people look at Tax Day the same way they look at pictures of themselves in middle school: with horror.
Taxes can be scary, stressful, and just plain confusing. Last year, TurboTax’s slogan was “There’s Nothing To Be Afraid Of," which certainly speaks to the general anxiety surrounding tax season. But overwhelming as they may be, taxes pay for our roads, schools, and major health programs. In other words, they’re important, and many people have learned the hard way that messing with the IRS is never a good idea, even for celebrities.
In order to shed light on a somewhat intimidating subject, Stacker has combed through IRS data to provide information on what Americans have paid in taxes over the past 30 years. This list is ordered chronologically, and each year refers to the fiscal year of October 1 to September 30. The term “gross collections” refers to collections prior to the issuing of refunds, and population count is based on both resident population and armed forces overseas as of October 1st each year. Without further ado, enjoy a little tax knowledge the way it should have always been presented: in a fun, not-at-all-scary slideshow.
RELATED: Ranking states with the highest and lowest beer taxes
1988
Gross collections: $935,106,594,000
Population: 246,329,000
Taxes paid per person: $3,796
Operating costs: 5,035,543,000
Cost of collecting per $100: 54 cents
In the immediate aftermath of the Tax Reform Act of 1986 and the Revenue Act of 1987, there was some confusion about which changes would be applicable by the time returns were filed in 1988. Ironically, the entire purpose of the 1986 Tax Reform Act was “to simplify the income tax code” for the general public.
1989
Gross collections: $1,013,322,133,000
Population: 249,412,000
Taxes paid per person: $4,063
Operating costs: 5,198,546,000
Cost of collecting per $100: 51 cents
In 1988, while campaigning for the presidency, George H. W. Bush made a bold pledge: “Read my lips. No new taxes!” Once his administration began in 1989, however, President Bush changed his tune. In the face of a recession, he went back on his campaign pledge and allowed a tax increase for high-income earners.
1990
Gross collections: $1,056,365,652,000
Population: 251,057,000
Taxes paid per person: $4,208
Operating costs: 5,440,418,000
Cost of collecting per $100: 52 cents
From 1990 to 1991, the U.S. experienced a short recession that brought unemployment up to 7.8%. Taxes were rising, against the wishes and campaign pledges of President George H. W. Bush. Issues in the stock market and loan failures didn’t help, either.
1991
Gross collections: $1,086,851,401,000
Population: 254,435,000
Taxes paid per person: $4,272
Operating costs: 6,097,627,000
Cost of collecting per $100: 56 cents
By March 1991, the brief recession was coming to an end, but 1991's taxes are still having an influence. In fact, taxes from that year may be impacting more than 133,000 veterans today. Dating back to 1991, taxes were wrongfully collected on disability severance, and massive refunds are currently in the works.
1992
Gross collections: $1,120,799,558,000
Population: 257,861,000
Taxes paid per person: $4,347
Operating costs: 6,536,336,000
Cost of collecting per $100: 58 cents
In 1992, “the average increase in the average tax rate reversed the decline that began after 1988.” In other words, this was the first time in several years that the average tax rate went up. The adjusted gross income increased from $37,603 the year prior, to a total of $40,168.
1993
Gross collections: $1,176,685,625,000
Population: 261,163,000
Taxes paid per person: $4,506
Operating costs: 7,077,985,000
Cost of collecting per $100: 60 cents
Bill Clinton’s presidency, which began in January 1993, certainly had an impact on taxes in the United States. It was this year that President Clinton signed his first budget, the Omnibus Budget Reconciliation Act, into effect. This act increased taxes for those earning more than $115,000 to 36%, and to 39.6% for those earning more than $250,000. The act also removed some corporate subsidies, and taxed corporations more aggressively.
1994
Gross collections: $1,276,466,776,000
Population: 264,301,000
Taxes paid per person: $4,830
Operating costs: 7,245,344,000
Cost of collecting per $100: 57 cents
1994 was not a happy year for Democrats. In a midterm election dubbed “The Republican Revolution,” Republicans gained 54 seats in the House and eight in the Senate, giving them control of both for the first time in decades. President Clinton’s tax law alterations, initiated the previous year, should have been popular for the middle class and roused Democratic support, but this was not the case.
1995
Gross collections: $1,375,731,836,000
Population: 267,456,000
Taxes paid per person: $5,144
Operating costs: 7,389,692,000
Cost of collecting per $100: 54 cents
Throughout the 1990s, the U.S. experienced a period of steady economic growth. In fact, this period marks the longest period of consistent growth the nation has ever seen: from 1994 to 1995, for example, the national deficit decreased from $203 billion to $164 billion. This growth is largely attributed to the Clinton administration’s economic policy and successful tax legislation.
1996
Gross collections: $1,486,546,674,000
Population: 270,581,000
Taxes paid per person: $5,494
Operating costs: 7,240,221,000
Cost of collecting per $100: 49 cents
This may come as a shock to many Americans, but Puerto Rico is in fact a commonwealth of the United States, making all Puerto Rican nationals U.S. citizens. There once existed a tax break on profits made by U.S. corporations in Puerto Rico, which drove many companies to manufacture there and greatly supported the Puerto Rican economy. When President Clinton signed a bill to phase out this tax break in 1996, Puerto Rico saw a major loss of jobs and industry. However, it’s also up for debate whether that tax break had more benefits for Puerto Rico or those corporations.
1997
Gross collections: $1,623,272,071,000
Population: 273,852,000
Taxes paid per person: $5,928
Operating costs: 7,163,541,000
Cost of collecting per $100: 44 cents
The Taxpayer Relief Act of 1997 was enacted in August of this year. Among its impacts was the Child Tax Credit, which aimed to offer more tax relief to those with children under the age of 17. The act also offered increased exemptions to family farms and small businesses.
1998
Gross collections: $1,769,408,739,000
Population: 277,003,000
Taxes paid per person: $6,388
Operating costs: 7,564,661,000
Cost of collecting per $100: 43 cents
In 1998, there may not have been Instagram, Facebook, or even the earliest hint of Myspace, but there certainly was the Internet. It was during this year that the “Internet Tax Freedom Act” came into play. The act essentially prevented “state and local governments from taxing Internet access, or imposing multiple or discriminatory taxes on electronic commerce.” In short, this was an attempt at providing free Internet access for all.
1999
Gross collections: $1,904,151,888,000
Population: 280,203,000
Taxes paid per person: $6,796
Operating costs: 8,269,387,000
Cost of collecting per $100: 43 cents
Today, anything paper has taken on a kind of vintage quality, with even rent payments by check becoming a thing of the past. But 20 years ago, the IRS was still learning how to navigate the wild world of the web. In 1986, the IRS piloted its very first e-file program, and in 1999, they introduced a pilot program that allowed taxpayers to sign returns electronically, rather than mail in a form.
2000
Gross collections: $2,096,916,925,000
Population: 283,201,000
Taxes paid per person: $7,404
Operating costs: 8,258,423,000
Cost of collecting per $100: 39 cents
It’s the year 2000. A contentious presidential election is looming and people are relieved that the world didn’t end. At this time, the U.S. was also experiencing a budget surplus, which then-presidential candidate George W. Bush proposed should be returned to the people in the form of tax relief.
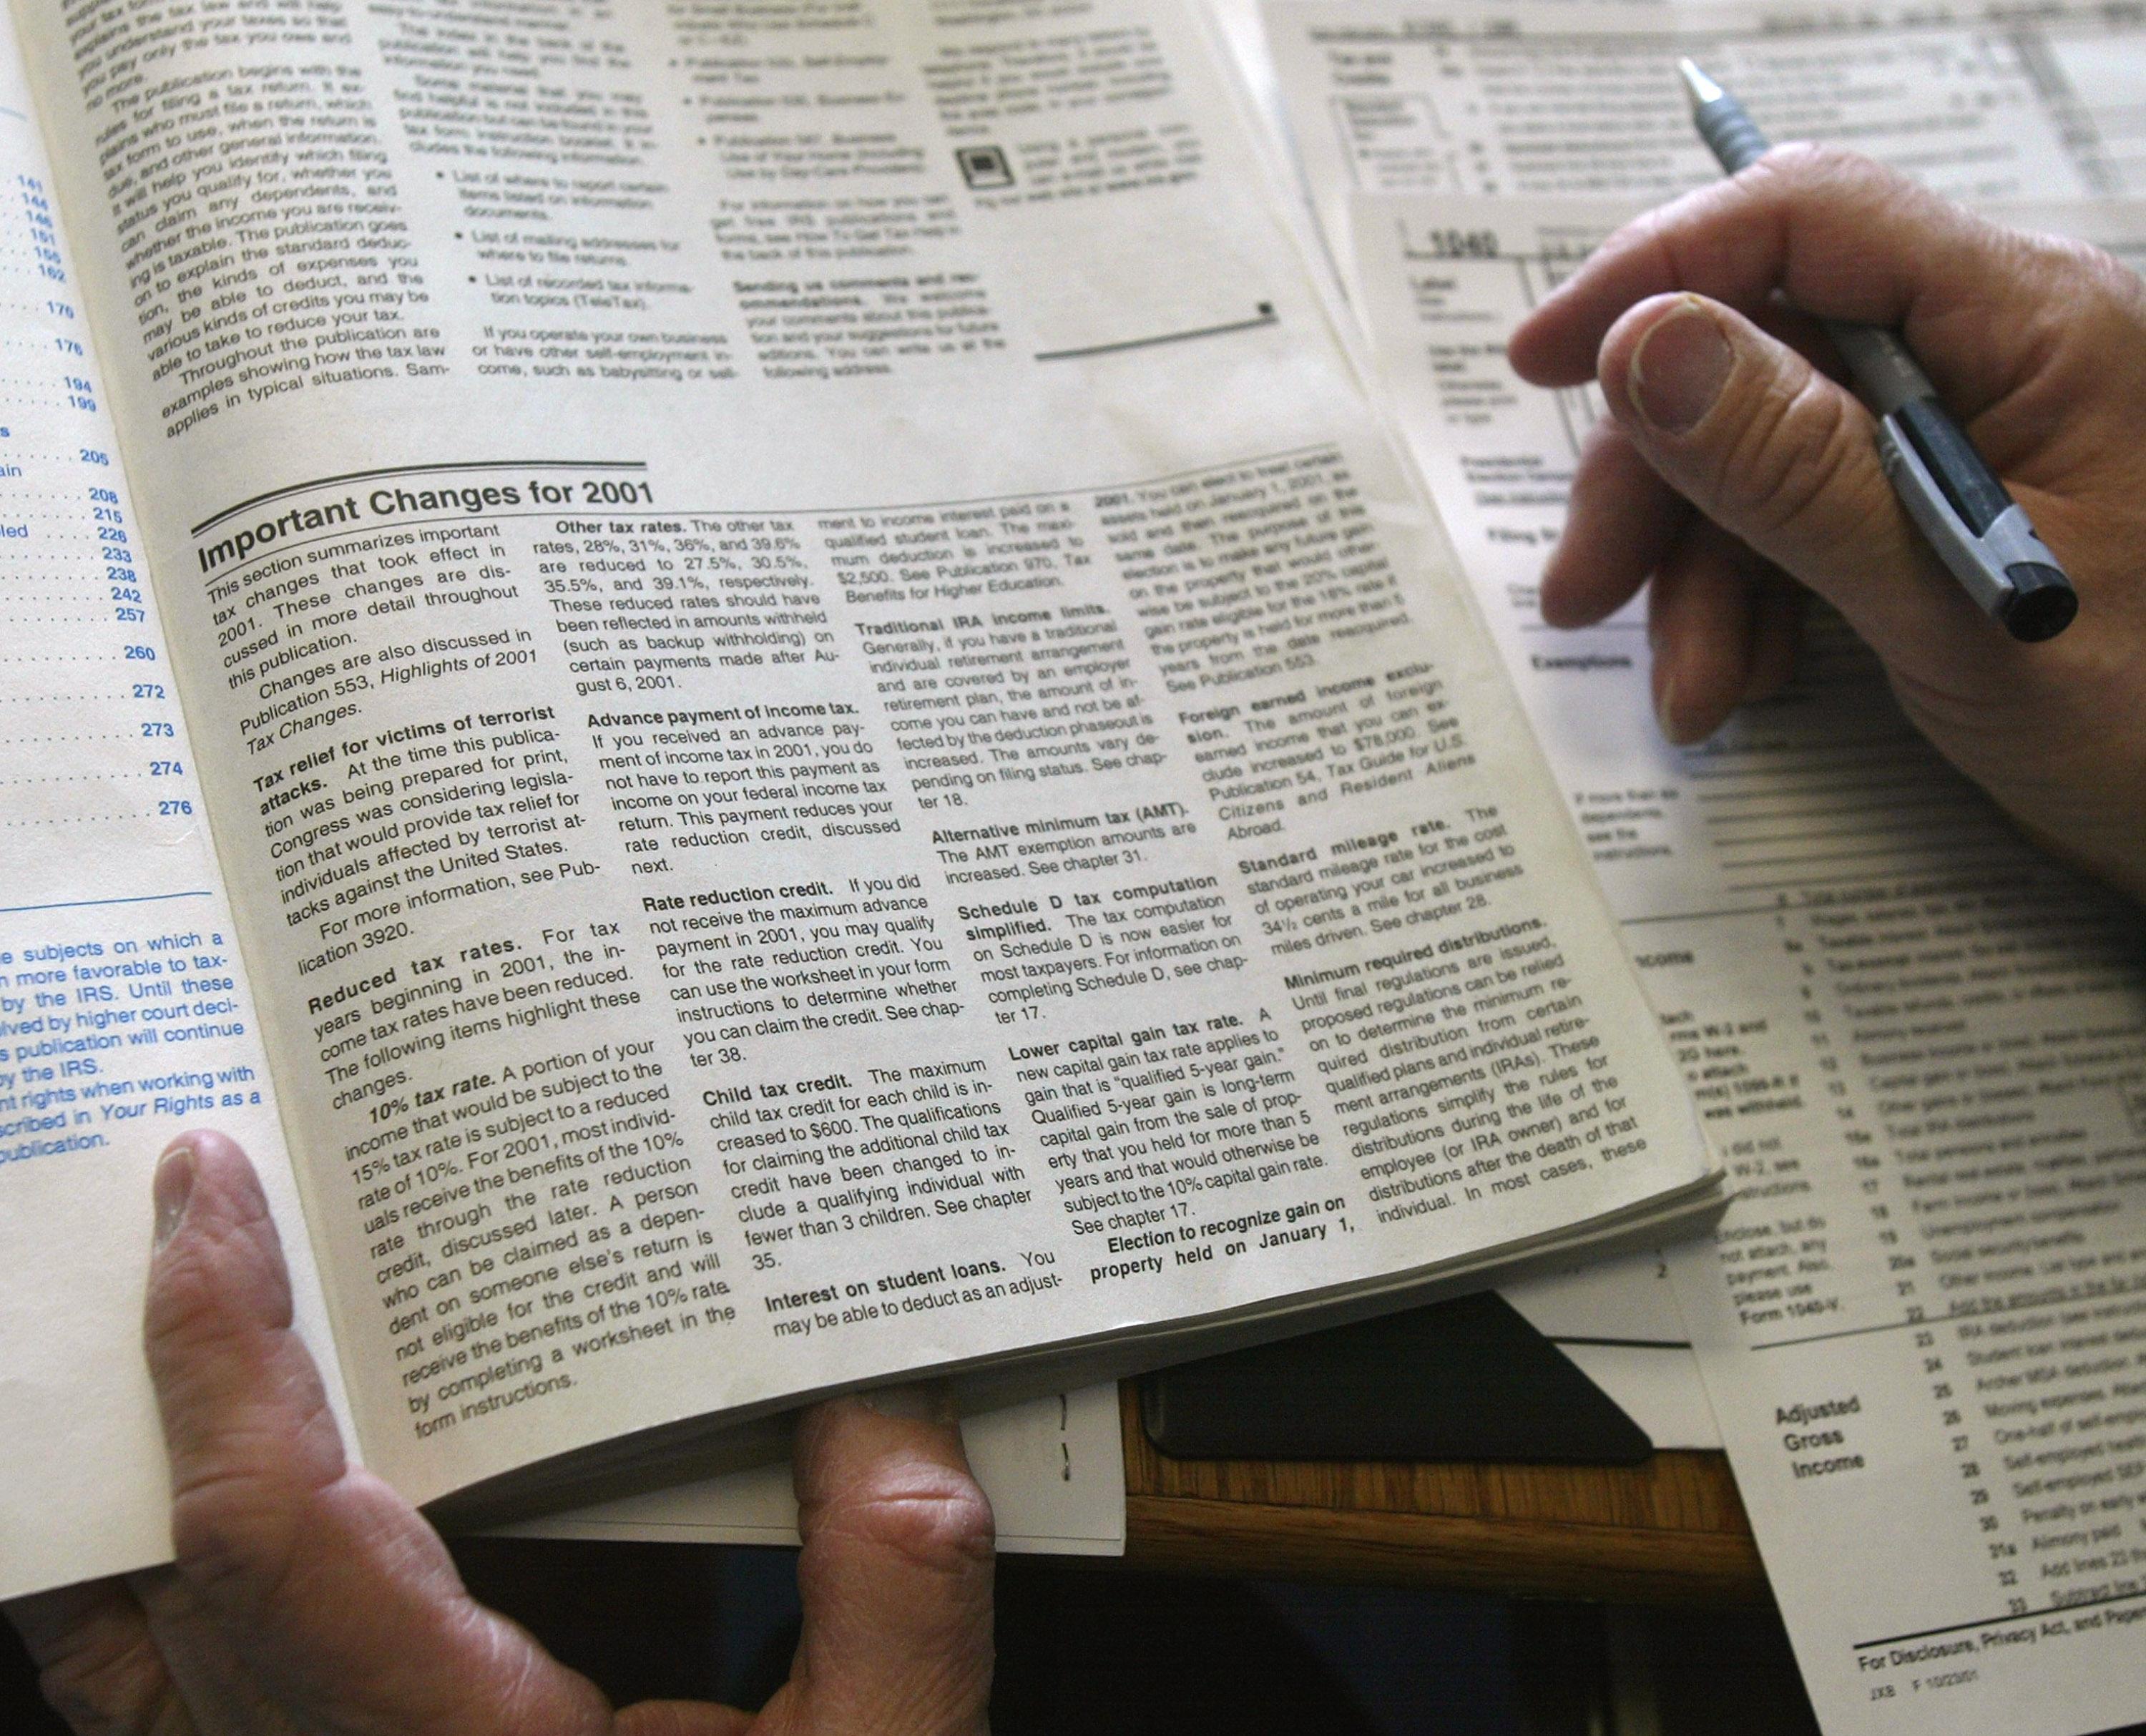
2001
Gross collections: $2,128,831,182,000
Population: 286,098,000
Taxes paid per person: $7,441
Operating costs: 8,771,510,000
Cost of collecting per $100: 41 cents
2001 saw the introduction of one of George W. Bush’s two major changes to tax law. In June, Bush signed the Economic Growth and Tax Relief Reconciliation Act (also known by the catchy abbreviation EGTRRA). This legislation including doubling the child tax credit, expanding the Earned Income Tax Credit, and lowering taxes for most people. While these tax cuts did save taxpayers a great deal over the next decade, they were also “phased in too slowly to boost the economy."
2002
Gross collections: $2,016,627,269,000
Population: 288,870,000
Taxes paid per person: $6,981
Operating costs: 9,063,471,000
Cost of collecting per $100: 45 cents
In 2002, the best bet for avoiding those pesky income and sales taxes would have been to stock up on parkas and snow boots in Alaska. Other top options for tax friendliness: South Dakota and Florida. On the other end of the tax spectrum was Maine, where residents were spending an average of 13.6% of their income on state and local taxes.
2003
Gross collections: $1,952,929,045,000
Population: 291,574,000
Taxes paid per person: $6,698
Operating costs: 9,401,407,000
Cost of collecting per $100: 48 cents
As a sequel to President George W. Bush’s 2001 EGTRRA, the Jobs and Growth Tax Relief Reconciliation Act (once again with a festive acronym, JGTRRA) was introduced in 2003. High-income earners saw the most direct benefits of these tax cuts: the top 1% of households received an average tax cut of $570,000 over the following decade.
2004
Gross collections: $2,018,502,103,000 benefited
Population: 294,230,000
Taxes paid per person: $6,860
Operating costs: 9,756,344,000
Cost of collecting per $100: 48 cents
Many American corporations keep their profits in overseas subsidiaries and “offshore tax havens like the Netherlands, Ireland, and the Cayman Islands," in order to keep that money away from the IRS. But in 2004, Congress enacted a one-time tax holiday, during which corporations had a chance to bring their money back to the U.S. at a reduced rate of taxation. Many corporations took advantage of this opportunity, and those who supported this act felt it was a success due to it putting $18 billion into treasury coffers.
2005
Gross collections: $2,268,895,122,000
Population: 296,972,000
Taxes paid per person: $7,640
Operating costs: 10,397,837,000
Cost of collecting per $100: 46 cents
In August of 2005, Hurricane Katrina struck the Gulf Coast of the United States, forcing the evacuation of more than one million people and killing nearly 2,000 others. In response, the Katrina Emergency Tax Relief Act was put into effect. This act offered tax relief to employers in the core disaster area and removed all limitations on charitable donations from individuals to those affected, among other measures.
2006
Gross collections: $2,518,680,230,000
Population: 299,835,000
Taxes paid per person: $8,400
Operating costs: 10,605,845,000
Cost of collecting per $100: 42 cents
For many Americans, the word “estate” may conjure up grand images, but for American senators in 2006, estates and their ensuing taxes were the topic of much political debate. In June of that year, a plan was proposed that would eliminate federal tax on all inherited estates, but the Senate came up three votes shy of what was needed to end the debate and go forward with the proposal.
2007
Gross collections: $2,691,537,557,000
Population: 302,807,000
Taxes paid per person: $8,889
Operating costs: 10,764,736,000
Cost of collecting per $100: 40 Cents
At first glance, 2007's numbers look like good news—yes, average taxes paid per person rose slightly, as is typical, but inflation-adjusted income of median households also rose by 1.3% from the previous year. A broader view of the numbers tells a slightly different story. In the economic cycle of 1989 to 2000, household income grew, while between 2000 and 2007—the next economic cycle—income fell overall.
2008
Gross collections: $2,745,035,410,000
Population: 305,554,000
Taxes paid per person: $8,984
Operating costs: 11,307,223,000
Cost of collecting per $100: 41 cents
Commonly called as the greatest financial collapse since the Great Depression, the Great Recession took place primarily in 2007 and 2008. After massive subprime loan losses, a bank bailout, and much general distress, the recession was technically over by mid-2009. Amidst all of this, research was being done on how best to avert these problems, potentially through the issuing of income tax rebates.
2009
Gross collections: $2,345,337,177,000
Population: 308,189,000
Taxes paid per person: $7,610
Operating costs: 11,708,604,000
Cost of collecting per $100: 50 cents
Yes, James Dean looks pretty darn good smoking a cigarette, but in recent years smoking has lost some of its luster. In fact, the number of smokers in the U.S. has declined by more than 20% since 2005. Part of this may be due to social norms changing, but there has also been an impact from increased cigarette taxes. From 1995 to 2009, the average tax on a pack of cigarettes in major tobacco-growing states increased by 444%.
2010
Gross collections: $2,345,055,978,000
Population: 310,425,000
Taxes paid per person: $7,554
Operating costs: 12,353,344,000
Cost of collecting per $100: 53 cents
On March 23, 2010, President Barack Obama signed the Patient Protection and Affordable Care Act into law. The road to bringing this bill to life was long, but President Obama believed, and said at the signing, that the bill encapsulated “the core principle that everybody should have some basic security when it comes to their health care.” Obamacare, as the ACA is often called, also had an impact on taxpayers, as it would ”increase the average tax burden significantly for families in the top 1% of the income distribution, but benefit families in the bottom income quintiles."
2011
Gross collections: $2,414,952,112,000
Population: 312,722,000
Taxes paid per person: $7,722
Operating costs: 12,358,877,000
Cost of collecting per $100: 51 cents
In December of 2010, President Obama signed the “Tax Relief, Unemployment Insurance Reauthorization, and Job Creation Act Of 2010” into effect. In September of 2011, Obama noted the impact of this act during in a speech in Detroit. He said that the average American family had “an extra $1,000 in their pocket” due to both Democrats and Republicans working together to bring this bill to life.
2012
Gross collections: $2,524,320,134,000
Population: 314,987,000
Taxes paid per person: $8,014
Operating costs: 12,059,409,000
Cost of collecting per $100: 48 cents
Another year, another government tax act. The American Taxpayer Relief Act of 2012 gave permanent status to some tax cuts made between 2001 and 2010. However, they had been set to expire in 2012. Research showed that failing to extend these tax cuts could have raised taxes “by more than $500 billion in 2013.”
2013
Gross collections: $2,855,059,420,000
Population: 317,214,000
Taxes paid per person: $9,000
Operating costs: 11,597,560,000
Cost of collecting per $100: 41 cents
The average taxes paid per person tend to rise every year, usually by a few hundred dollars. But between 2012 and 2013, the average taxes paid per person rose by nearly $1,000. In fact, thanks to President Obama, “the rich paid more in taxes in 2013 than they did in 1980."
2014
Gross collections: $3,064,301,358,000
Population: 319,605,000
Taxes paid per person: $9,588
Operating costs: 11,591,007,000
Cost of collecting per $100: 38 cents
The daunting nature of paying taxes may have scared some 2014 tax payers off from their fair share of money. In early 2018, the IRS announced that $1.1 billion in tax refunds, due to nearly a million Americans not filing a return for that year. Past that three-year window, the money becomes property of the U.S. Treasury.
2015
Gross collections: $3,302,677,258,000
Population: 321,966,000
Taxes paid per person: $10,258
Operating costs: 11,395,839,000
Cost of collecting per $100: 35 cents
As 2014 drew to a close, and Americans began to see the April tax deadline approaching, there was plenty of work to be done. When tax laws change, it can impact a family’s budget, and there were a few changes set for 2015 that would do just that. For instance, the tax penalty for not having health insurance rose from 1% to 2% per household in 2015, and employee 401(k) contribution limitations increased.
2016
Gross collections: $3,333,449,083,000
Population: 324,299,000
Taxes paid per person: $10,279
Operating costs: 11,707,422,000
Cost of collecting per $100: 35 cents
In December 2015 (which falls into the 2016 fiscal year), the White House passed a package of tax cuts, which added more than half a trillion dollars to the U.S. deficit. Most agreed, whether in favor of the bill or not, that it signified a core belief of Speaker of the House Paul Ryan: tax cuts ultimately pay for themselves by fostering economic growth.”
2017
Gross collections: $3,416,714,139,000
Population: 326,613,000
Taxes paid per person: $10,461
Operating costs: 11,526,389,000
Cost of collecting per $100: 34 cents
In January of 2017, Donald J. Trump became the 45th President of the United States. Throughout his campaign, he made assertions and promises regarding taxes, some of which have been kept, and some of which have not. One important note on this slide: the 2017 population listed here is an estimate by the U.S. Census Bureau.


