How much carbon dioxide does your state emit?
How much carbon dioxide does your state emit?
It was June 2017 when President Donald Trump withdrew the United States from the Paris Accords, the global initiative for working to prevent an overall 2-degree Celsius rise in temperature. Climate science is a hot-button issue, and drastic policy and administrative changes have clouded what's in store for the future.
Over the past couple of years, the current administration has rolled back on multiple environmental protection policies, most recently, the Obama-era Waters of the United States: On Sept. 12, 2019, Andrew Wheeler, the Environmental Protection Agency's administrator, announced the clean water policy's repeal, citing concern of federal "overreach."
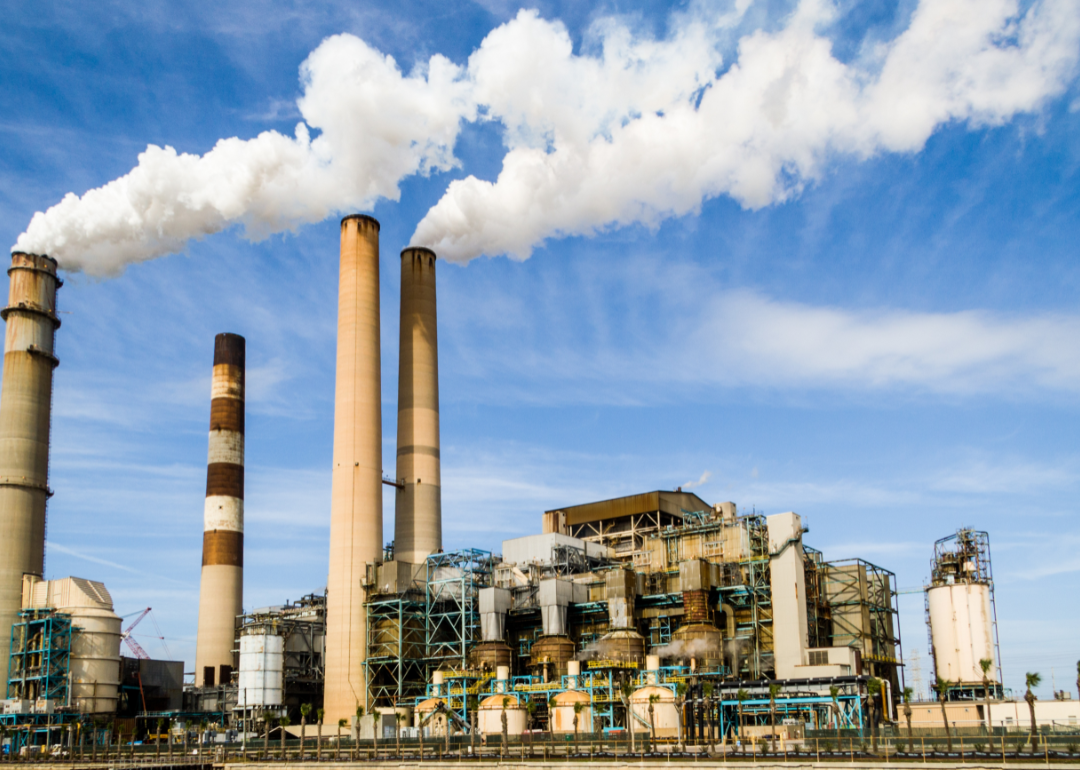
Bike-share programs and the occasional solar-powered home aren't enough to tackle the rise in fossil fuel use. Even though green initiatives and renewable energy have become trendy and it may appear as though people are leaning toward more environmentally conscious lifestyles, human-caused carbon dioxide emissions due to fossil fuels and industries have actually increased.
Moreover, the increase of carbon dioxide levels can be mapped—generally, each state emits a different amount. Emissions depend on elements including industries in the area, number of vehicles on the road, and also the population size. Using 2016 data from the U.S. Energy Information Administration's most recent carbon dioxide emissions report, Stacker looked into each state's total and per capita CO2 emissions, as well as the change in emissions since 2000.
Keep reading to see how your state ranks among the rest in CO2 emissions.
You may also like: States that consume the most energy
#51. District of Columbia
- Total carbon dioxide emissions in 2016: 2.8 million metric tons (0.1% of all state emissions)
- CO2 emissions per capita: 4 metric tons (#1 lowest)
- Change in total CO2 emissions 2000-2016: 35.7% decrease (#1 biggest decrease in emissions)
#50. Vermont
- Total carbon dioxide emissions in 2016: 6 million metric tons (0.1% of all state emissions)
- CO2 emissions per capita: 9.6 metric tons (#8 lowest)
- Change in total CO2 emissions 2000-2016: 11.9% decrease (#26 biggest decrease in emissions)
#49. Rhode Island
- Total carbon dioxide emissions in 2016: 9.8 million metric tons (0.2% of all state emissions)
- CO2 emissions per capita: 9.2 metric tons (#4 lowest)
- Change in total CO2 emissions 2000-2016: 17% decrease (#20 biggest decrease in emissions)
#48. Delaware
- Total carbon dioxide emissions in 2016: 13.3 million metric tons (0.3% of all state emissions)
- CO2 emissions per capita: 14 metric tons (#22 lowest)
- Change in total CO2 emissions 2000-2016: 16.6% decrease (#21 biggest decrease in emissions)
#47. New Hampshire
- Total carbon dioxide emissions in 2016: 13.8 million metric tons (0.3% of all state emissions)
- CO2 emissions per capita: 10.3 metric tons (#10 lowest)
- Change in total CO2 emissions 2000-2016: 21.3% decrease (#10 biggest decrease in emissions)
#46. South Dakota
- Total carbon dioxide emissions in 2016: 15.0 million metric tons (0.3% of all state emissions)
- CO2 emissions per capita: 17.4 metric tons (#21 highest)
- Change in total CO2 emissions 2000-2016: 5.7% increase (#5 biggest increase in emissions)
#45. Maine
- Total carbon dioxide emissions in 2016: 16.5 million metric tons (0.3% of all state emissions)
- CO2 emissions per capita: 12.4 metric tons (#16 lowest)
- Change in total CO2 emissions 2000-2016: 26.4% decrease (#2 biggest decrease in emissions)
#44. Idaho
- Total carbon dioxide emissions in 2016: 18.4 million metric tons (0.4% of all state emissions)
- CO2 emissions per capita: 10.9 metric tons (#12 lowest)
- Change in total CO2 emissions 2000-2016: 17.1% increase (#1 biggest increase in emissions)
#43. Hawaii
- Total carbon dioxide emissions in 2016: 18.4 million metric tons (0.4% of all state emissions)
- CO2 emissions per capita: 12.9 metric tons (#20 lowest)
- Change in total CO2 emissions 2000-2016: 1.1% decrease (#41 biggest decrease in emissions)
#42. Montana
- Total carbon dioxide emissions in 2016: 30.5 million metric tons (0.6% of all state emissions)
- CO2 emissions per capita: 29.3 metric tons (#6 highest)
- Change in total CO2 emissions 2000-2016: 0.1% increase (#10 biggest increase in emissions)
#41. Connecticut
- Total carbon dioxide emissions in 2016: 34.3 million metric tons (0.7% of all state emissions)
- CO2 emissions per capita: 9.6 metric tons (#9 lowest)
- Change in total CO2 emissions 2000-2016: 20.2% decrease (#12 biggest decrease in emissions)
#40. Alaska
- Total carbon dioxide emissions in 2016: 34.9 million metric tons (0.7% of all state emissions)
- CO2 emissions per capita: 47.0 metric tons (#4 highest)
- Change in total CO2 emissions 2000-2016: 21.4% decrease (#9 biggest decrease in emissions)
#39. Nevada
- Total carbon dioxide emissions in 2016: 36.7 million metric tons (0.7% of all state emissions)
- CO2 emissions per capita: 12.5 metric tons (#18 lowest)
- Change in total CO2 emissions 2000-2016: 19.2% decrease (#13 biggest decrease in emissions)
#38. Oregon
- Total carbon dioxide emissions in 2016: 38.0 million metric tons (0.7% of all state emissions)
- CO2 emissions per capita: 9.3 metric tons (#5 lowest)
- Change in total CO2 emissions 2000-2016: 7.3% decrease (#33 biggest decrease in emissions)
#37. New Mexico
- Total carbon dioxide emissions in 2016: 48.4 million metric tons (0.9% of all state emissions)
- CO2 emissions per capita: 23.2 metric tons (#14 highest)
- Change in total CO2 emissions 2000-2016: 16.5% decrease (#22 biggest decrease in emissions)
#36. Nebraska
- Total carbon dioxide emissions in 2016: 48.6 million metric tons (0.9% of all state emissions)
- CO2 emissions per capita: 25.4 metric tons (#9 highest)
- Change in total CO2 emissions 2000-2016: 16.7% increase (#2 biggest increase in emissions)
#35. North Dakota
- Total carbon dioxide emissions in 2016: 54.3 million metric tons (1.1% of all state emissions)
- CO2 emissions per capita: 71.8 metric tons (#2 highest)
- Change in total CO2 emissions 2000-2016: 7.1% increase (#4 biggest increase in emissions)
#34. Maryland
- Total carbon dioxide emissions in 2016: 57.6 million metric tons (1.1% of all state emissions)
- CO2 emissions per capita: 9.6 metric tons (#7 lowest)
- Change in total CO2 emissions 2000-2016: 25.0% decrease (#3 biggest decrease in emissions)
#33. Utah
- Total carbon dioxide emissions in 2016: 58.8 million metric tons (1.1% of all state emissions)
- CO2 emissions per capita: 19.3 metric tons (#19 highest)
- Change in total CO2 emissions 2000-2016: 9.4% decrease (#29 biggest decrease in emissions)
#32. Wyoming
- Total carbon dioxide emissions in 2016: 60.7 million metric tons (1.2% of all state emissions)
- CO2 emissions per capita: 103.7 metric tons (#1 highest)
- Change in total CO2 emissions 2000-2016: 3.5% decrease (#38 biggest decrease in emissions)
#31. Kansas
- Total carbon dioxide emissions in 2016: 62.1 million metric tons (1.2% of all state emissions)
- CO2 emissions per capita: 21.3 metric tons (#16 highest)
- Change in total CO2 emissions 2000-2016: 18.1% decrease (#18 biggest decrease in emissions)
#30. Arkansas
- Total carbon dioxide emissions in 2016: 62.4 million metric tons (1.2% of all state emissions)
- CO2 emissions per capita: 20.9 metric tons (#17 highest)
- Change in total CO2 emissions 2000-2016: 1.9% decrease (#40 biggest decrease in emissions)
#29. Massachusetts
- Total carbon dioxide emissions in 2016: 64.2 million metric tons (1.2% of all state emissions)
- CO2 emissions per capita: 9.4 metric tons (#6 lowest)
- Change in total CO2 emissions 2000-2016: 22.2% decrease (#6 biggest decrease in emissions)
#28. Mississippi
- Total carbon dioxide emissions in 2016: 68.9 million metric tons (1.3% of all state emissions)
- CO2 emissions per capita: 23.1 metric tons (#15 highest)
- Change in total CO2 emissions 2000-2016: 12.6% increase (#3 biggest increase in emissions)
#27. South Carolina
- Total carbon dioxide emissions in 2016: 71.7 million metric tons (1.4% of all state emissions)
- CO2 emissions per capita: 14.5 metric tons (#23 lowest)
- Change in total CO2 emissions 2000-2016: 11.2% decrease (#28 biggest decrease in emissions)
#26. Iowa
- Total carbon dioxide emissions in 2016: 73.1 million metric tons (1.4% of all state emissions)
- CO2 emissions per capita: 23.4 metric tons (#13 highest)
- Change in total CO2 emissions 2000-2016: 6.0% decrease (#34 biggest decrease in emissions)
#25. Washington
- Total carbon dioxide emissions in 2016: 78.9 million metric tons (1.5% of all state emissions)
- CO2 emissions per capita: 10.8 metric tons (#11 lowest)
- Change in total CO2 emissions 2000-2016: 1.0% increase (#9 biggest increase in emissions)
#24. Arizona
- Total carbon dioxide emissions in 2016: 87.0 million metric tons (1.7% of all state emissions)
- CO2 emissions per capita: 12.6 metric tons (#19 lowest)
- Change in total CO2 emissions 2000-2016: 1.1% increase (#7 biggest increase in emissions)
#23. Colorado
- Total carbon dioxide emissions in 2016: 89.0 million metric tons (1.7% of all state emissions)
- CO2 emissions per capita: 16.1 metric tons (#25 highest)
- Change in total CO2 emissions 2000-2016: 5.4% increase (#6 biggest increase in emissions)
#22. Minnesota
- Total carbon dioxide emissions in 2016: 89.3 million metric tons (1.7% of all state emissions)
- CO2 emissions per capita: 16.2 metric tons (#24 highest)
- Change in total CO2 emissions 2000-2016: 8.4% decrease (#31 biggest decrease in emissions)
#21. West Virginia
- Total carbon dioxide emissions in 2016: 94.6 million metric tons (1.8% of all state emissions)
- CO2 emissions per capita: 51.7 metric tons (#3 highest)
- Change in total CO2 emissions 2000-2016: 17.2% decrease (#19 biggest decrease in emissions)
#20. Wisconsin
- Total carbon dioxide emissions in 2016: 95.6 million metric tons (1.9% of all state emissions)
- CO2 emissions per capita: 16.6 metric tons (#23 highest)
- Change in total CO2 emissions 2000-2016: 11.3% decrease (#27 biggest decrease in emissions)
#19. Oklahoma
- Total carbon dioxide emissions in 2016: 96.9 million metric tons (1.9% of all state emissions)
- CO2 emissions per capita: 24.7 metric tons (#10 highest)
- Change in total CO2 emissions 2000-2016: 2.6% decrease (#39 biggest decrease in emissions)
#18. Tennessee
- Total carbon dioxide emissions in 2016: 103.1 million metric tons (2% of all state emissions)
- CO2 emissions per capita: 15.5 metric tons (#25 lowest)
- Change in total CO2 emissions 2000-2016: 18.8% decrease (#17 biggest decrease in emissions)
#17. Virginia
- Total carbon dioxide emissions in 2016: 104.2 million metric tons (2% of all state emissions)
- CO2 emissions per capita: 12.4 metric tons (#17 lowest)
- Change in total CO2 emissions 2000-2016: 15.2% decrease (#23 biggest decrease in emissions)
#16. New Jersey
- Total carbon dioxide emissions in 2016: 110.8 million metric tons (2.1% of all state emissions)
- CO2 emissions per capita: 12.3 metric tons (#15 lowest)
- Change in total CO2 emissions 2000-2016: 9.1% decrease (#30 biggest decrease in emissions)
#15. Alabama
- Total carbon dioxide emissions in 2016: 115.1 million metric tons (2.2% of all state emissions)
- CO2 emissions per capita: 23.7 metric tons (#11 highest)
- Change in total CO2 emissions 2000-2016: 19.1% decrease (#15 biggest decrease in emissions)
#14. Missouri
- Total carbon dioxide emissions in 2016: 117.7 million metric tons (2.3% of all state emissions)
- CO2 emissions per capita: 19.3 metric tons (#18 highest)
- Change in total CO2 emissions 2000-2016: 5.9% decrease (#35 biggest decrease in emissions)
#13. North Carolina
- Total carbon dioxide emissions in 2016: 120.6 million metric tons (2.3% of all state emissions)
- CO2 emissions per capita: 11.9 metric tons (#14 lowest)
- Change in total CO2 emissions 2000-2016: 19% decrease (#16 biggest decrease in emissions)
#12. Kentucky
- Total carbon dioxide emissions in 2016: 123.9 million metric tons (2.4% of all state emissions)
- CO2 emissions per capita: 27.9 metric tons (#7 highest)
- Change in total CO2 emissions 2000-2016: 13.8% decrease (#24 biggest decrease in emissions)
#11. Georgia
- Total carbon dioxide emissions in 2016: 136.2 million metric tons (2.6% of all state emissions)
- CO2 emissions per capita: 13.2 metric tons (#21 lowest)
- Change in total CO2 emissions 2000-2016: 19.2% decrease (#14 biggest decrease in emissions)
#10. Michigan
- Total carbon dioxide emissions in 2016: 151.8 million metric tons (2.9% of all state emissions)
- CO2 emissions per capita: 15.3 metric tons (#24 lowest)
- Change in total CO2 emissions 2000-2016: 21.5% decrease (#8 biggest decrease in emissions)
#9. New York
- Total carbon dioxide emissions in 2016: 163.7 million metric tons (3.2% of all state emissions)
- CO2 emissions per capita: 8.3 metric tons (#2 lowest)
- Change in total CO2 emissions 2000-2016: 22.7% decrease (#5 biggest decrease in emissions)
#8. Indiana
- Total carbon dioxide emissions in 2016: 181.9 million metric tons (3.5% of all state emissions)
- CO2 emissions per capita: 27.4 metric tons (#8 highest)
- Change in total CO2 emissions 2000-2016: 23% decrease (#4 biggest decrease in emissions)
#7. Illinois
- Total carbon dioxide emissions in 2016: 204.1 million metric tons (4% of all state emissions)
- CO2 emissions per capita: 15.9 metric tons (#26 lowest)
- Change in total CO2 emissions 2000-2016: 11.9% decrease (#25 biggest decrease in emissions)
#6. Ohio
- Total carbon dioxide emissions in 2016: 206.3 million metric tons (4% of all state emissions)
- CO2 emissions per capita: 17.7 metric tons (#20 highest)
- Change in total CO2 emissions 2000-2016: 21.9% decrease (#7 biggest decrease in emissions)
#5. Louisiana
- Total carbon dioxide emissions in 2016: 209.1 million metric tons (4.1% of all state emissions)
- CO2 emissions per capita: 44.6 metric tons (#5 highest)
- Change in total CO2 emissions 2000-2016: 7.3% decrease (#32 biggest decrease in emissions)
#4. Pennsylvania
- Total carbon dioxide emissions in 2016: 217.4 million metric tons (4.2% of all state emissions)
- CO2 emissions per capita: 17 metric tons (#22 highest)
- Change in total CO2 emissions 2000-2016: 21% decrease (#11 biggest decrease in emissions)
#3. Florida
- Total carbon dioxide emissions in 2016: 230.1 million metric tons (4.5% of all state emissions)
- CO2 emissions per capita: 11.1 metric tons (#13 lowest)
- Change in total CO2 emissions 2000-2016: 4% decrease (#37 biggest decrease in emissions)
#2. California
- Total carbon dioxide emissions in 2016: 361.4 million metric tons (7% of all state emissions)
- CO2 emissions per capita: 9.2 metric tons (#3 lowest)
- Change in total CO2 emissions 2000-2016: 4.2% decrease (#36 biggest decrease in emissions)
#1. Texas
- Total carbon dioxide emissions in 2016: 653.8 million metric tons (12.7% of all state emissions)
- CO2 emissions per capita: 23.4 metric tons (#12 highest)
- Change in total CO2 emissions 2000-2016: 1% increase (#8 biggest increase in emissions)