This story originally appeared on Routific and was produced and distributed in partnership with Stacker Studio.
These cities had the worst traffic last year
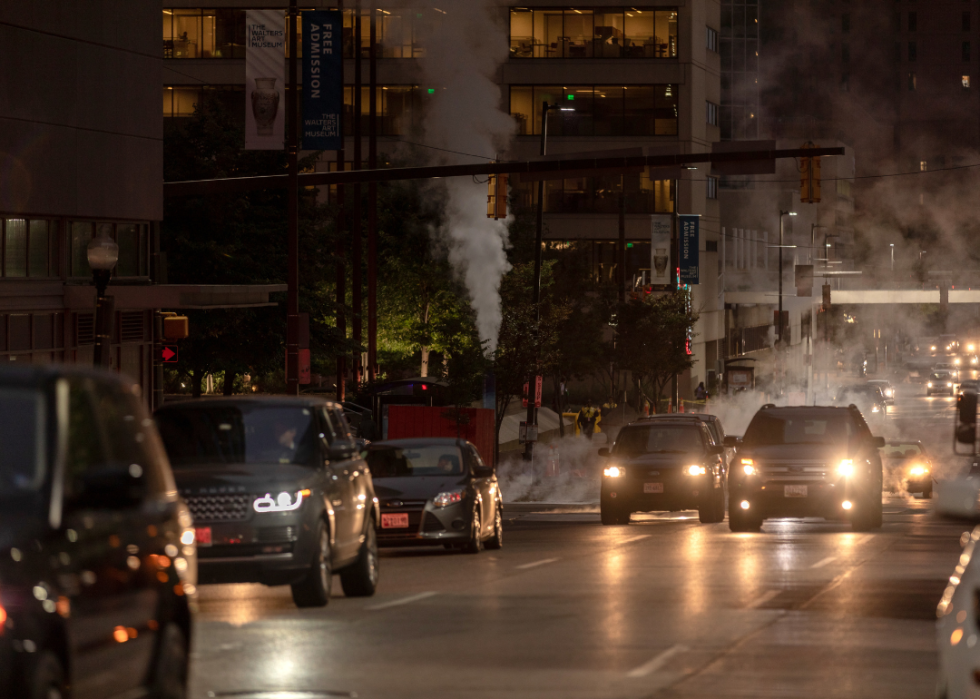
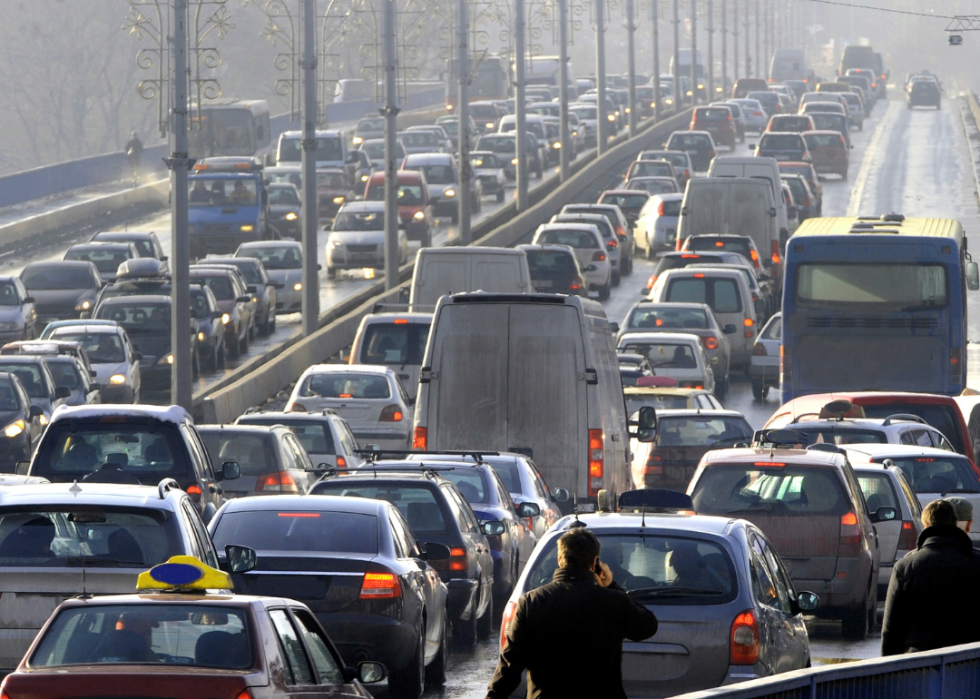
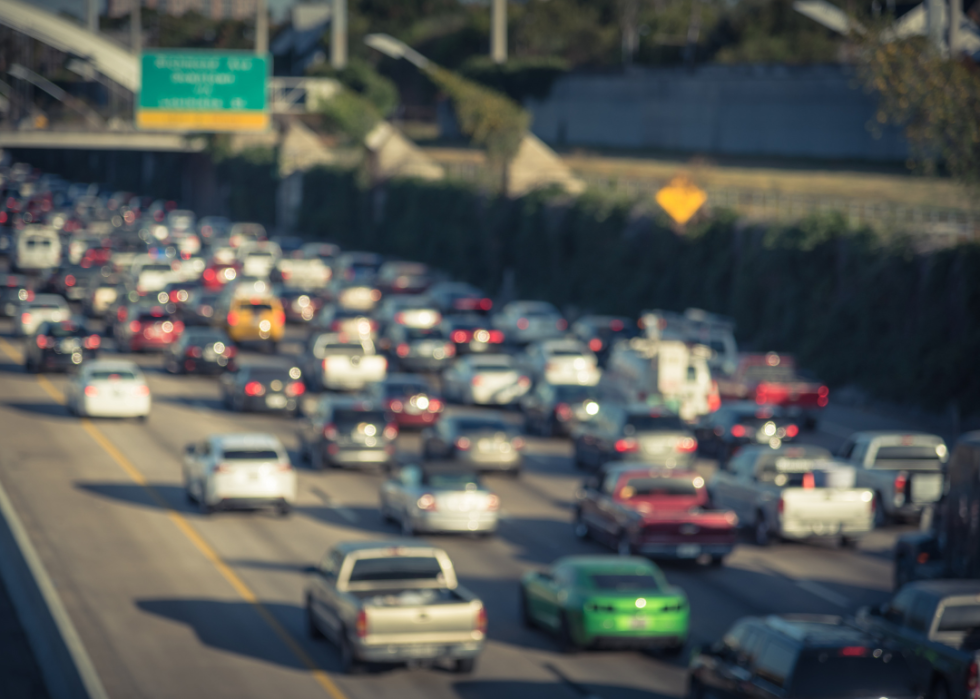
Nobody likes traffic backups. The experience of sitting bumper-to-bumper is frustrating for a number of reasons, from running late for work or picking up the kids to simply feeling stuck with nothing you can do about it. Most people tend to do what they can to avoid the experience of sitting in traffic by timing their commutes to avoid rush hour and planning alternate routes, among other tactics.
Using data from the 2021 Global Traffic Scorecard, Routific identified the worst 25 cities in the U.S. for traffic delays and calculated how much those delays cost drivers based on the metro's median hourly wage. Commute times were calculated by looking exclusively at the time it takes to get to and from major employment centers, based on anonymized GPS data to find commuting patterns.
In some cities, sitting in traffic is simply unavoidable. Traffic congestion is caused by several factors, among them the road grid (how a given road system is laid out); the density of the environment in terms of residents, businesses, and popular attractions; the availability (or lack thereof) of public transportation options; and the sheer volume of cars and trucks on the road. For many cities, commuting slowed during the start of the COVID-19 pandemic, but traffic congestion returned as Americans eased out of restrictions.
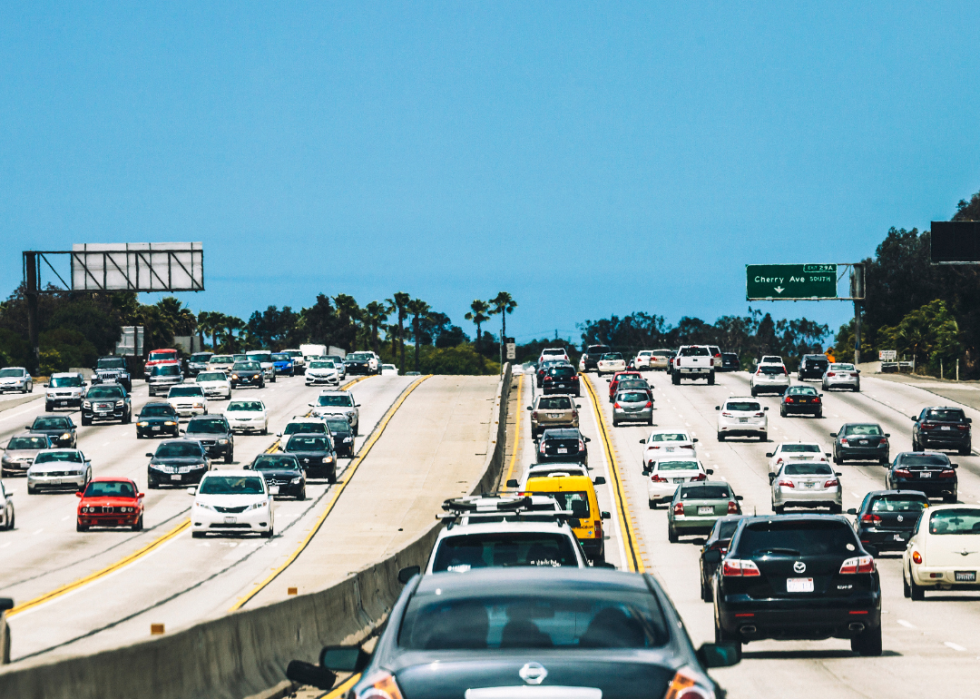
One pandemic lifestyle habit that seems here to stay is online shopping: From March 2020 to February 2022, Americans spent a staggering $1.7 trillion on e-commerce, according to Adobe Analytics. With millions of online purchases moving back and forth across the country, it's only added to daily congestion. More truck drivers are on roadways shipping goods to warehouses—and more delivery drivers are in neighborhoods distributing parcels every day. Expect more in the future as the Bureau of Labor Statistics projects that demand for delivery truck drivers will increase by 12%—faster than the average growth of all occupations—with 190,700 jobs available each year for the next decade.
Growth and expansion of a given urban area is also a significant contributor, as population growth often exceeds a city's ability to grow its transportation system to meet the demand. Some of the most prevalent examples of the past few years are the cities of Dallas, Phoenix, and Houston—all of which are on this list and among the 10 most populous cities in the country.
If you live in a major city, odds are your town is on this list—but there are a few surprises for those who think smaller means easier to get around. In our data points highlighted below, the time loss is calculated by analyzing peak speed and free-flow speed data for the busiest commuting corridors. The annual added cost data was calculated based on the 2021 median hourly wage in the metro area according to the U.S. Bureau of Labor Statistics.
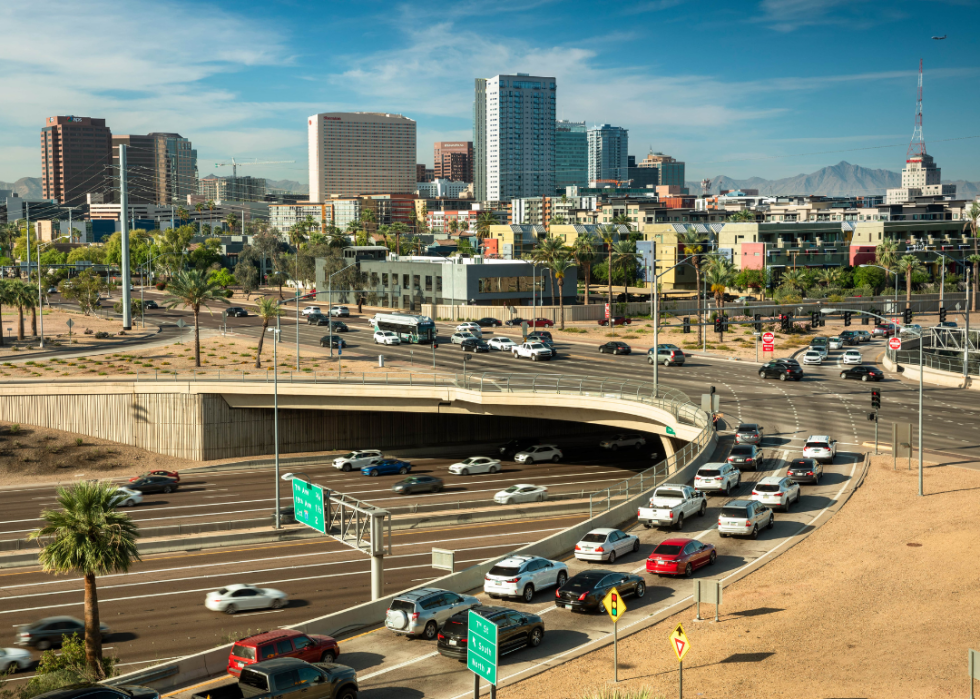
#25. Phoenix, Arizona
- Time lost per driver in 2021 due to congestion: 21 hours
- Annual added cost per driver: $460
- Trips downtown: down 7% since pre-COVID
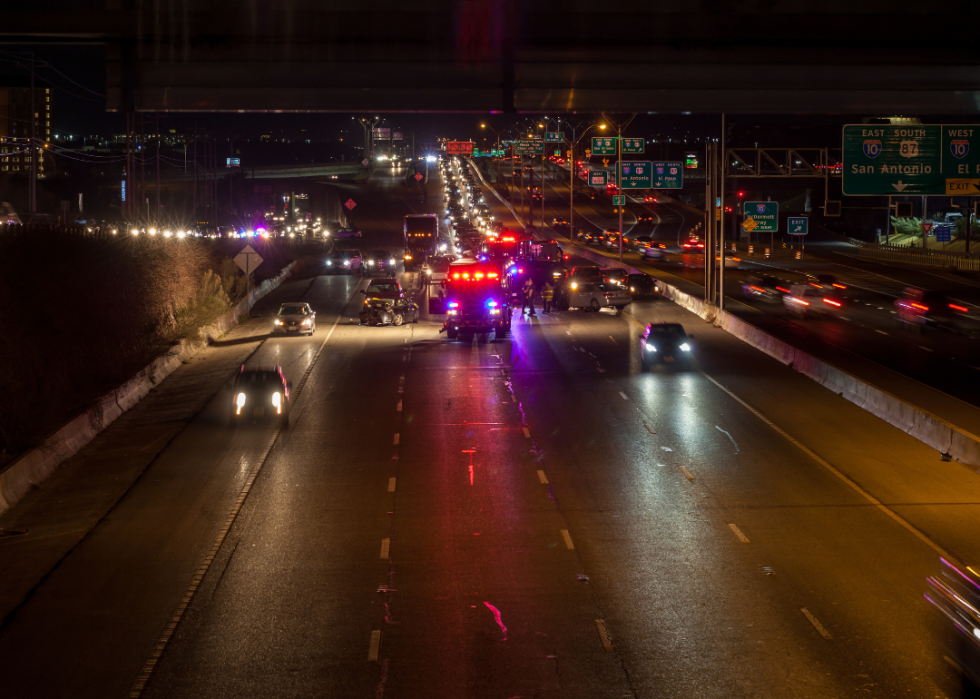
#24. San Antonio, Texas
- Time lost per driver in 2021 due to congestion: 23 hours
- Annual added cost per driver: $572
- Trips downtown: down 5% since pre-COVID
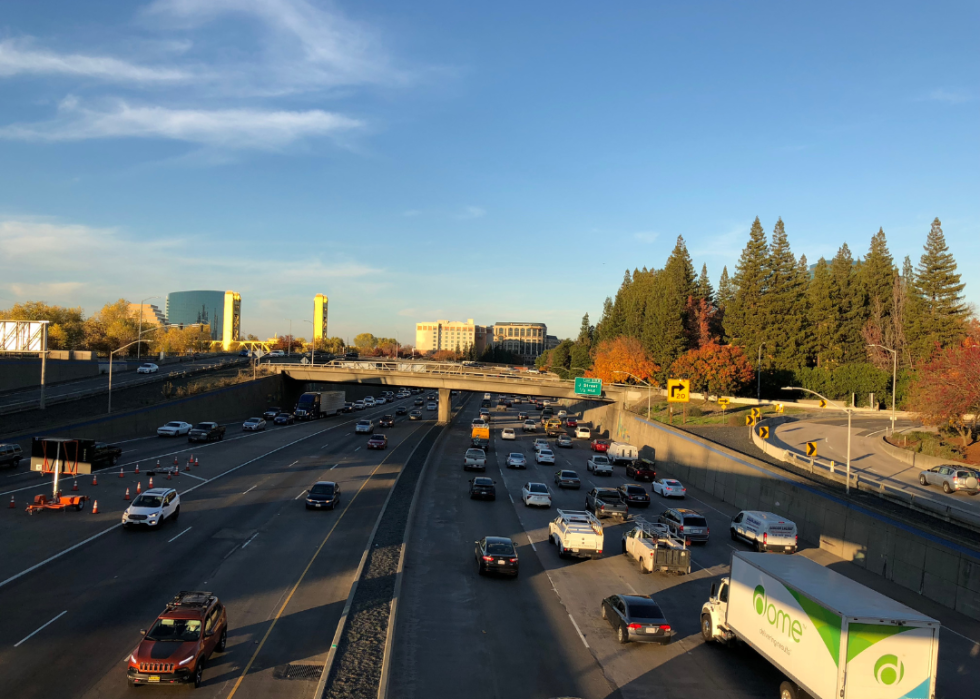
#23. Sacramento, California
- Time lost per driver in 2021 due to congestion: 25 hours
- Annual added cost per driver: $584
- Trips downtown: down 30% since pre-COVID

#22. Las Vegas, Nevada
- Time lost per driver in 2021 due to congestion: 28 hours
- Annual added cost per driver: $505
- Trips downtown: down 3% since pre-COVID
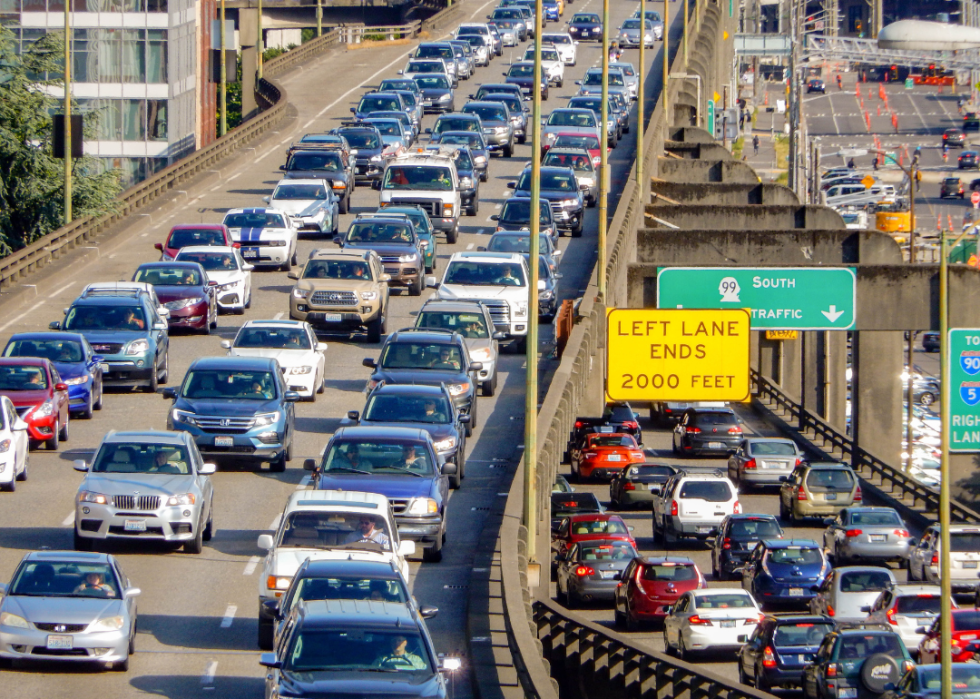
#21. Seattle, Washington
- Time lost per driver in 2021 due to congestion: 30 hours
- Annual added cost per driver: $869
- Trips downtown: down 36% since pre-COVID
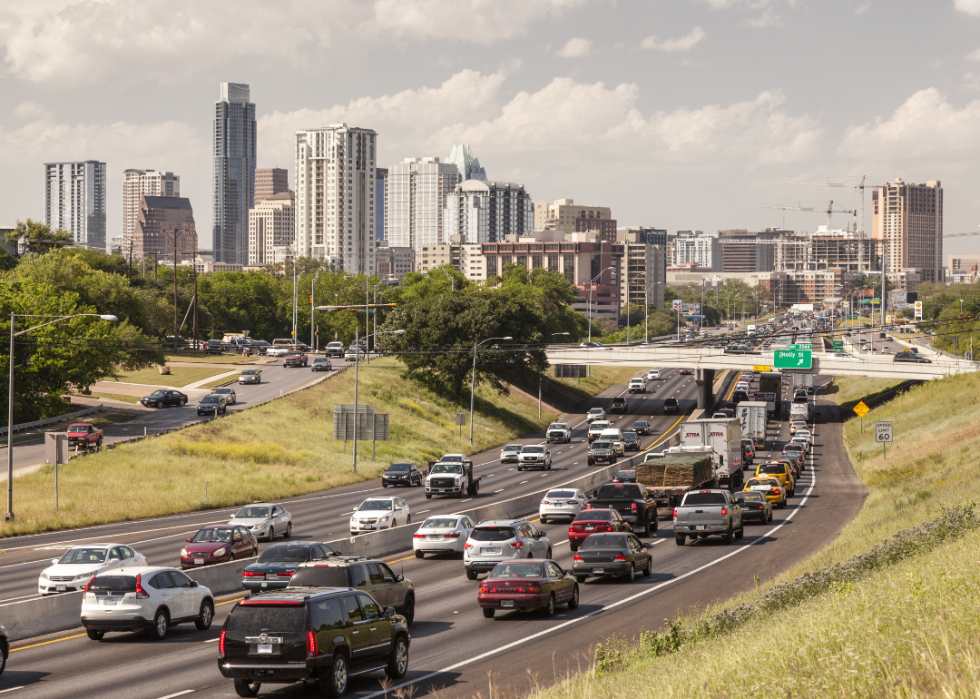
#20. Austin, Texas
- Time lost per driver in 2021 due to congestion: 32 hours
- Annual added cost per driver: $722
- Trips downtown: down 21% since pre-COVID
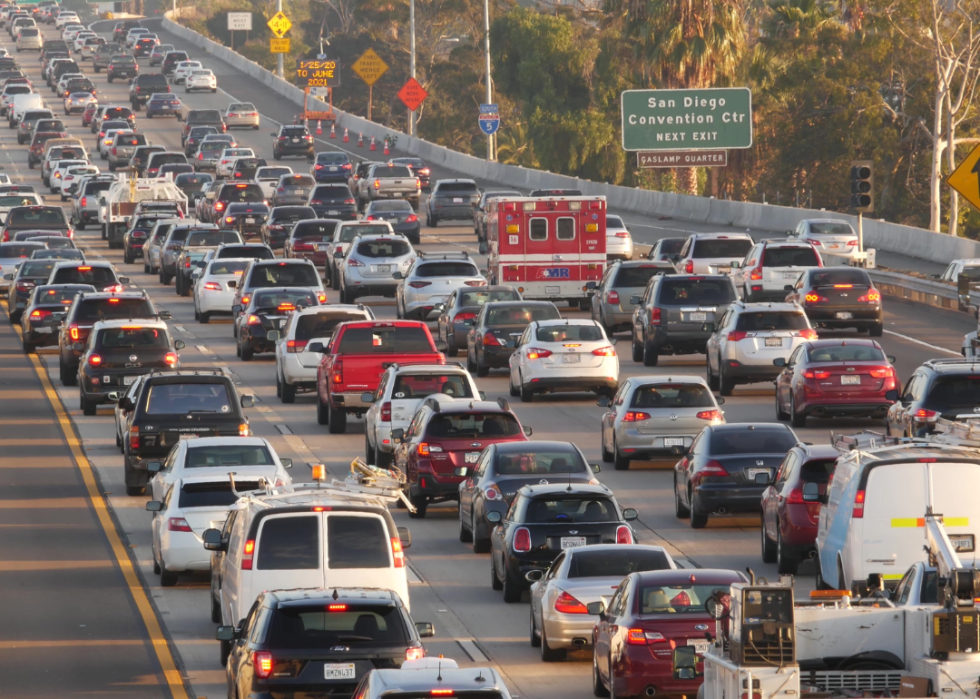
#19. San Diego, California
- Time lost per driver in 2021 due to congestion: 32 hours
- Annual added cost per driver: $739
- Trips downtown: down 12% since pre-COVID
#18. Baltimore, Maryland
- Time lost per driver in 2021 due to congestion: 37 hours
- Annual added cost per driver: $855
- Trips downtown: down 23% since pre-COVID
#17. Providence, Rhode Island
- Time lost per driver in 2021 due to congestion: 38 hours
- Annual added cost per driver: $866
- Trips downtown: down 5% since pre-COVID
#16. Concord, California
- Time lost per driver in 2021 due to congestion: 40 hours
- Annual added cost per driver: $1,192
- Trips downtown: down 8% since pre-COVID
#15. Denver, Colorado
- Time lost per driver in 2021 due to congestion: 40 hours
- Annual added cost per driver: $946
- Trips downtown: down 10% since pre-COVID
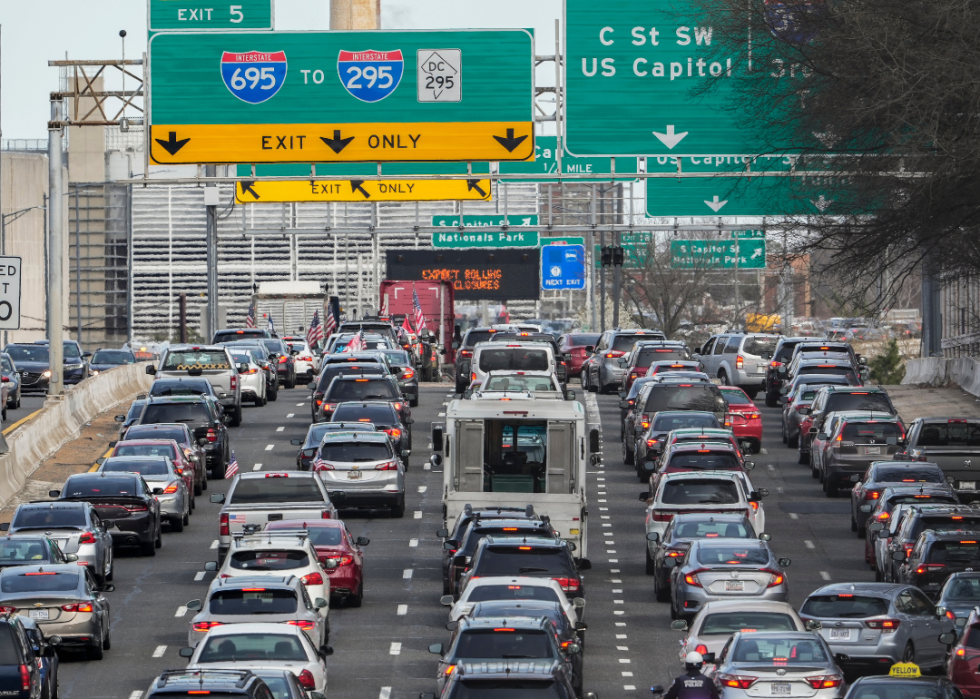
#14. Washington D.C.
- Time lost per driver in 2021 due to congestion: 44 hours
- Annual added cost per driver: $1,304
- Trips downtown: down 38% since pre-COVID
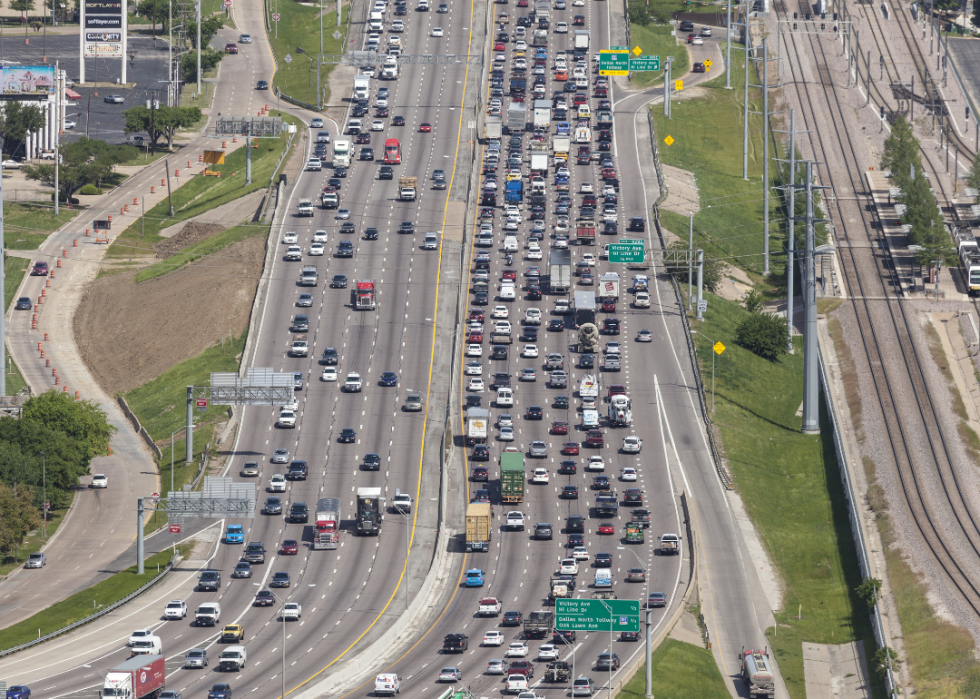
#13. Dallas, Texas
- Time lost per driver in 2021 due to congestion: 44 hours
- Annual added cost per driver: $962
- Trips downtown: down 32% since pre-COVID
#12. Stamford, Connecticut
- Time lost per driver in 2021 due to congestion: 46 hours
- Annual added cost per driver: $1,150
- Trips downtown: down 24% since pre-COVID
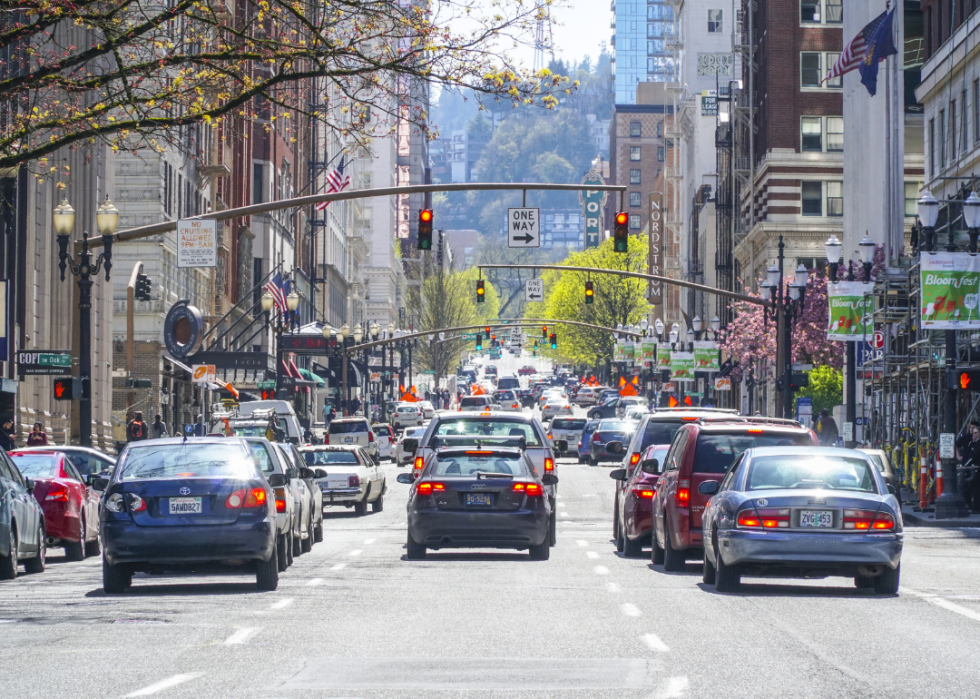
#11. Portland, Oregon
- Time lost per driver in 2021 due to congestion: 48 hours
- Annual added cost per driver: $1,116
- Trips downtown: down 32% since pre-COVID
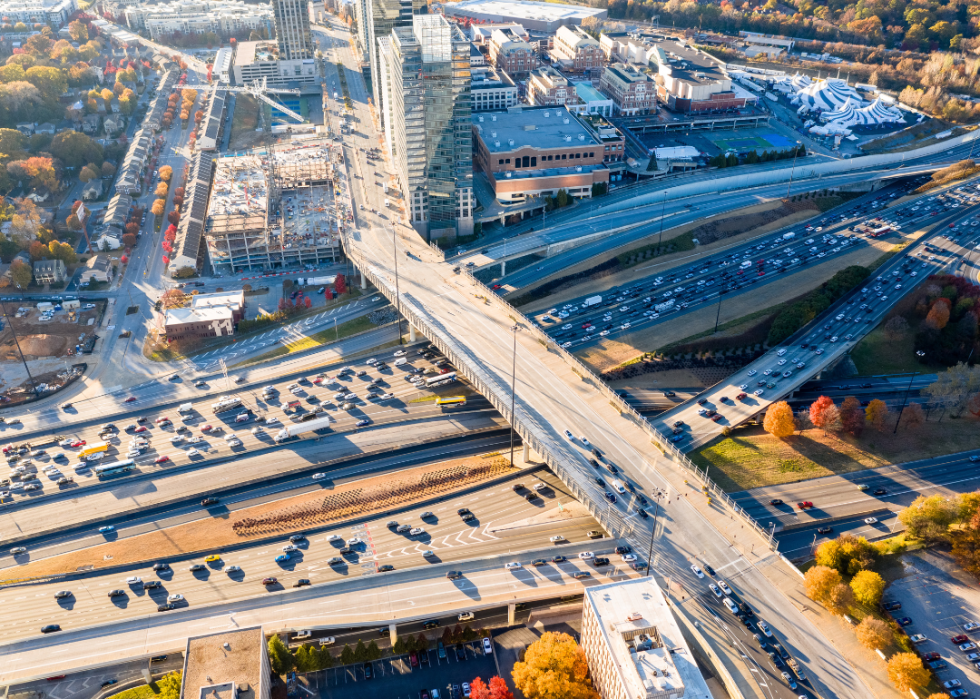
#10. Atlanta, Georgia
- Time lost per driver in 2021 due to congestion: 53 hours
- Annual added cost per driver: $1,167
- Trips downtown: down 16% since pre-COVID
#9. Houston, Texas
- Time lost per driver in 2021 due to congestion: 58 hours
- Annual added cost per driver: $1,245
- Trips downtown: down 25% since pre-COVID
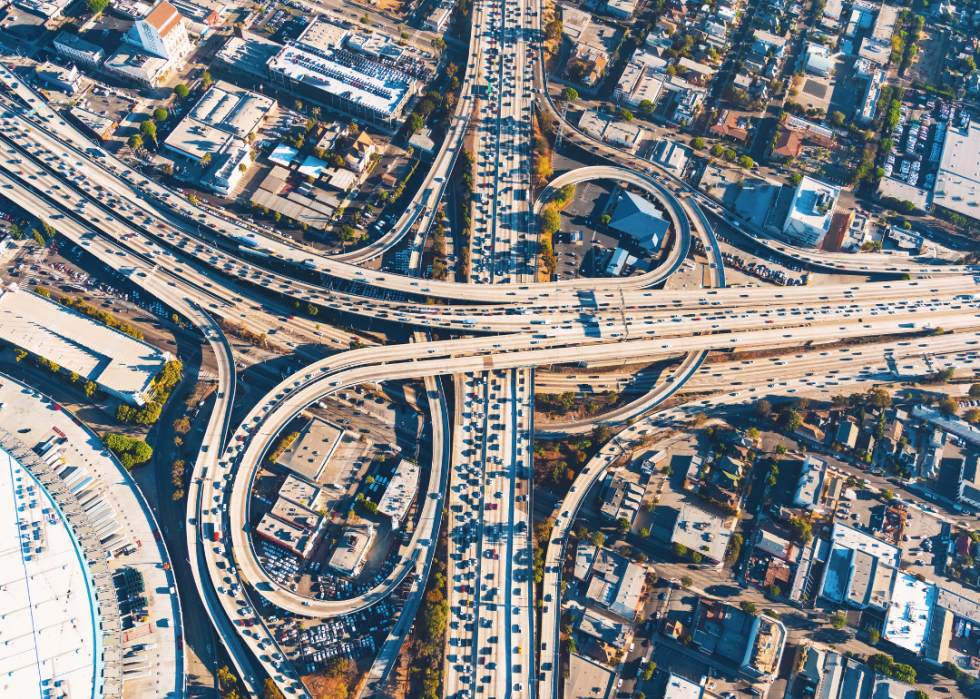
#8. Los Angeles, California
- Time lost per driver in 2021 due to congestion: 62 hours
- Annual added cost per driver: $1,418
- Trips downtown: down 28% since pre-COVID
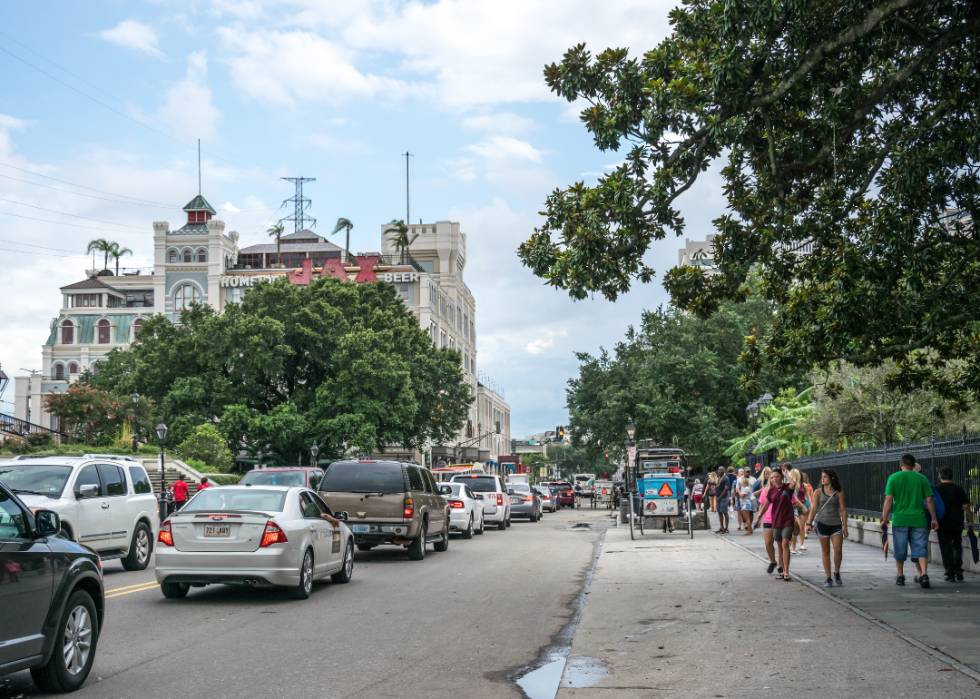
#7. New Orleans, Louisiana
- Time lost per driver in 2021 due to congestion: 63 hours
- Annual added cost per driver: $1,153
- Trips downtown: down 28% since pre-COVID
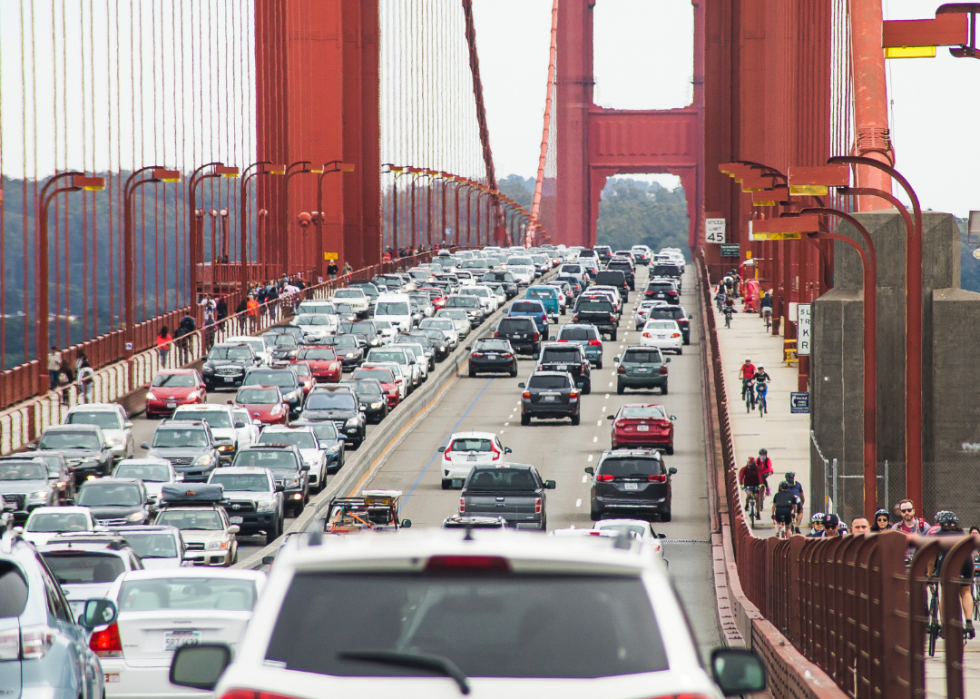
#6. San Francisco, California
- Time lost per driver in 2021 due to congestion: 64 hours
- Annual added cost per driver: $1,908
- Trips downtown: down 49% since pre-COVID
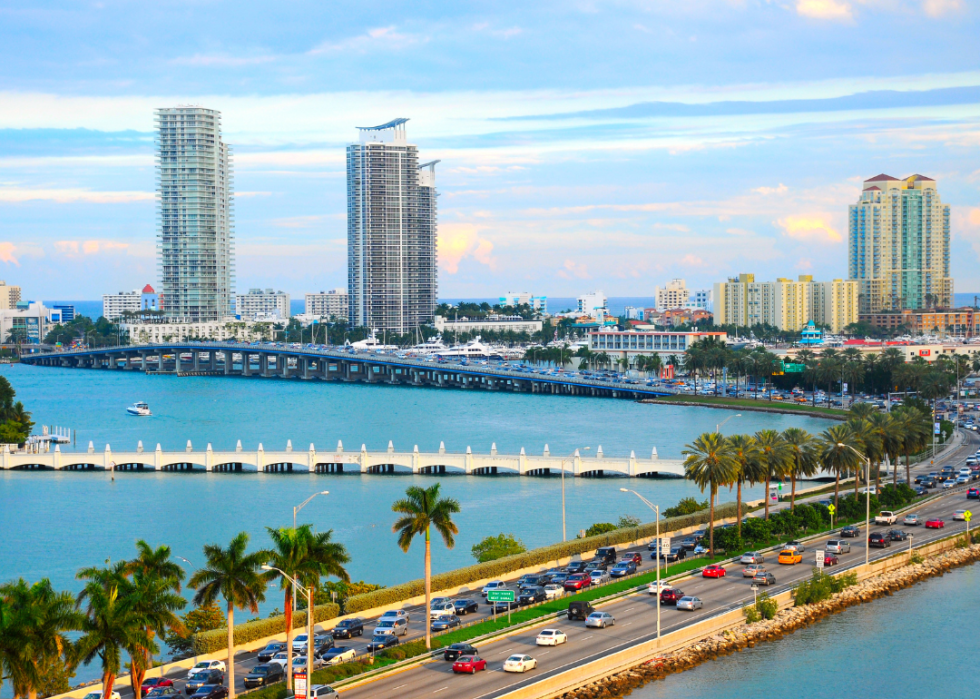
#5. Miami, Florida
- Time lost per driver in 2021 due to congestion: 66 hours
- Annual added cost per driver: $1,227
- Trips downtown: down 20% since pre-COVID
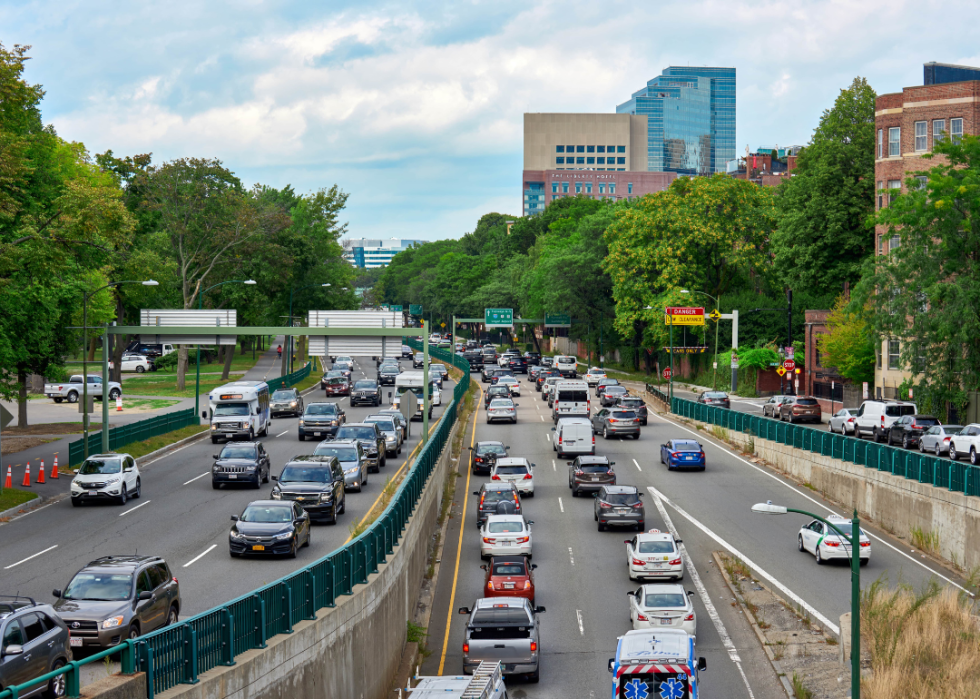
#4. Boston, Massachusetts
- Time lost per driver in 2021 due to congestion: 78 hours
- Annual added cost per driver: $2,272
- Trips downtown: down 23% since pre-COVID

#3. Philadelphia, Pennsylvania
- Time lost per driver in 2021 due to congestion: 90 hours
- Annual added cost per driver: $2,057
- Trips downtown: down 22% since pre-COVID
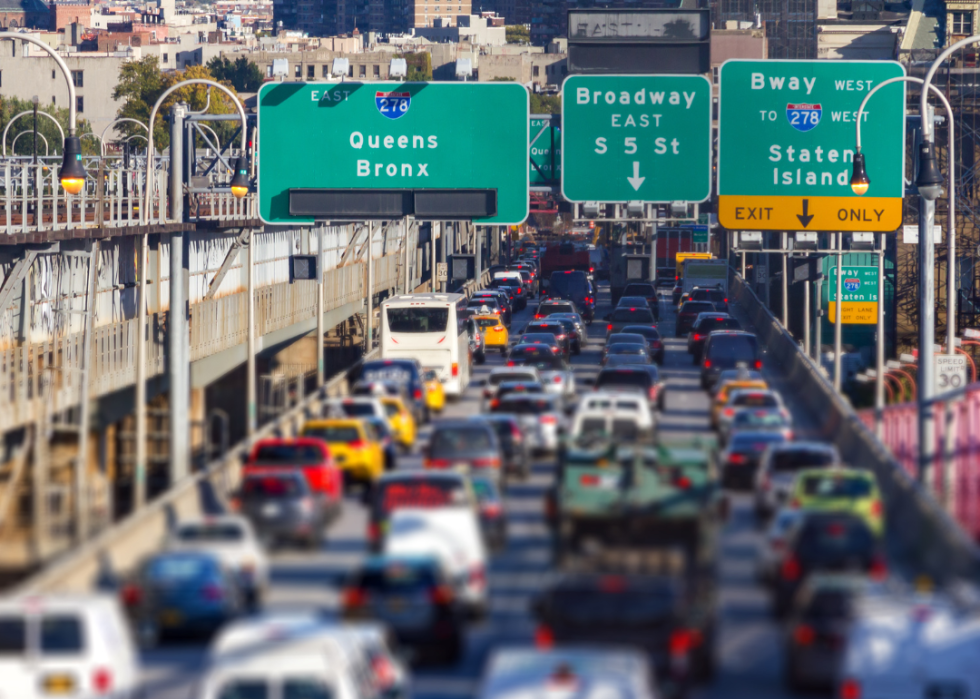
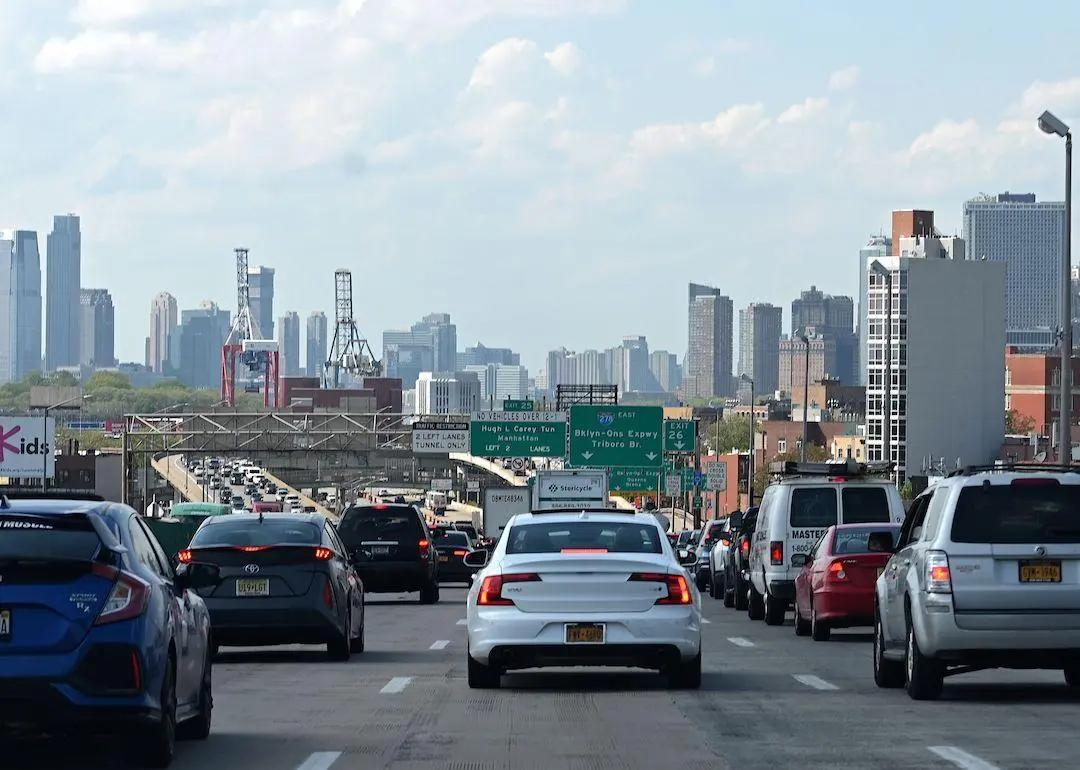
#2. New York City, New York
- Time lost per driver in 2021 due to congestion: 102 hours
- Annual added cost per driver: $2,737
- Trips downtown: down 18% since pre-COVID
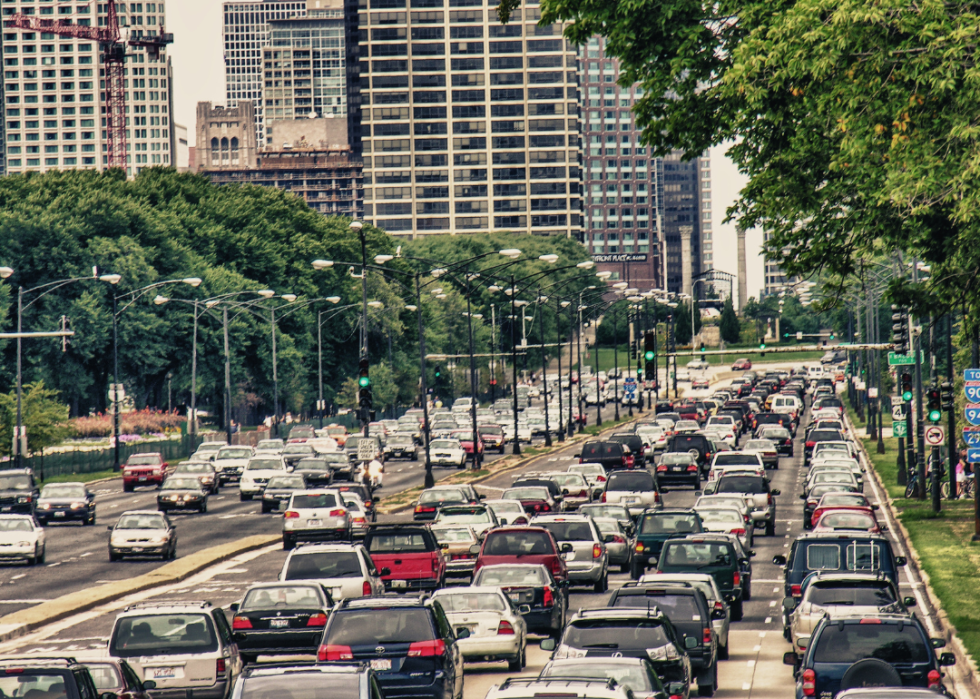
#1. Chicago, Illinois
- Time lost per driver in 2021 due to congestion: 104 hours
- Annual added cost per driver: $2,365
- Trips downtown: down 21% since pre-COVID