Metros where homes are selling for the most under asking price
Metros where homes are selling for the most under asking price
It's a tough time to be in the market for a new house. But as peak homebuying season begins, homebuyers are starting to have at least some negotiating power, especially in markets with considerable price growth over the last few years.
The average 30-year fixed-rate mortgage rose above 7% at the start of November 2022, the highest level in more than a decade, as the Federal Reserve raised its benchmark rates to combat inflation. Rates remain at historic highs. Even a half percentage point change can significantly affect the monthly payments required for a mortgage.
Since mortgage rates were under 4% for the better part of the past decade, many homebuyers locked in far more affordable rates than what's on offer in today's environment. And sellers aren't exactly coming down on price—nationally, home prices are still increasing, just more slowly than they did during the height of the COVID-19 pandemic.
The median sale price in March was $420,321, 4.83% higher than the year before. Of homes sold, 30.02% went for above the list price, and the average price difference was 0.76% below asking.
Stacker analyzed data from Redfin to see where homes are selling for the most below the asking price. Metros, which include the main city and its surrounding town and suburbs, are ranked by the average sale-to-list ratio, which is the difference between what a home listed for and how much a buyer paid. Metros with fewer than 300 home sales are excluded from this list. Also shown are the metro area's median listing prices for homes on the market and median sale prices for homes that sold during that month.

#50. Baton Rouge, Louisiana
- Average price difference: 2.06% below list
-- Median list price: $274,995
-- Median sale price: $260,000
- Total homes sold: 781
-- Share that sold above list: 14.1%

#49. Asheville, North Carolina
- Average price difference: 2.07% below list
-- Median list price: $497,490
-- Median sale price: $439,932
- Total homes sold: 504
-- Share that sold above list: 20.8%

#48. Evansville, Indiana
- Average price difference: 2.13% below list
-- Median list price: $210,000
-- Median sale price: $212,700
- Total homes sold: 324
-- Share that sold above list: 23.5%

#47. Gary, Indiana
- Average price difference: 2.2% below list
-- Median list price: $284,900
-- Median sale price: $260,000
- Total homes sold: 669
-- Share that sold above list: 18.1%

#46. Lakeland, Florida
- Average price difference: 2.2% below list
-- Median list price: $330,000
-- Median sale price: $320,000
- Total homes sold: 1,367
-- Share that sold above list: 14.6%

#45. Lake Havasu City, Arizona
- Average price difference: 2.24% below list
-- Median list price: $389,000
-- Median sale price: $369,900
- Total homes sold: 333
-- Share that sold above list: 11.4%

#44. Tallahassee, Florida
- Average price difference: 2.25% below list
-- Median list price: $300,000
-- Median sale price: $290,000
- Total homes sold: 381
-- Share that sold above list: 19.7%

#43. Tulsa, Oklahoma
- Average price difference: 2.27% below list
-- Median list price: $275,000
-- Median sale price: $265,000
- Total homes sold: 1,083
-- Share that sold above list: 28.3%

#42. Austin, Texas
- Average price difference: 2.29% below list
-- Median list price: $499,990
-- Median sale price: $450,000
- Total homes sold: 2,671
-- Share that sold above list: 15.6%

#41. Orlando, Florida
- Average price difference: 2.36% below list
-- Median list price: $420,000
-- Median sale price: $403,000
- Total homes sold: 3,633
-- Share that sold above list: 13.3%

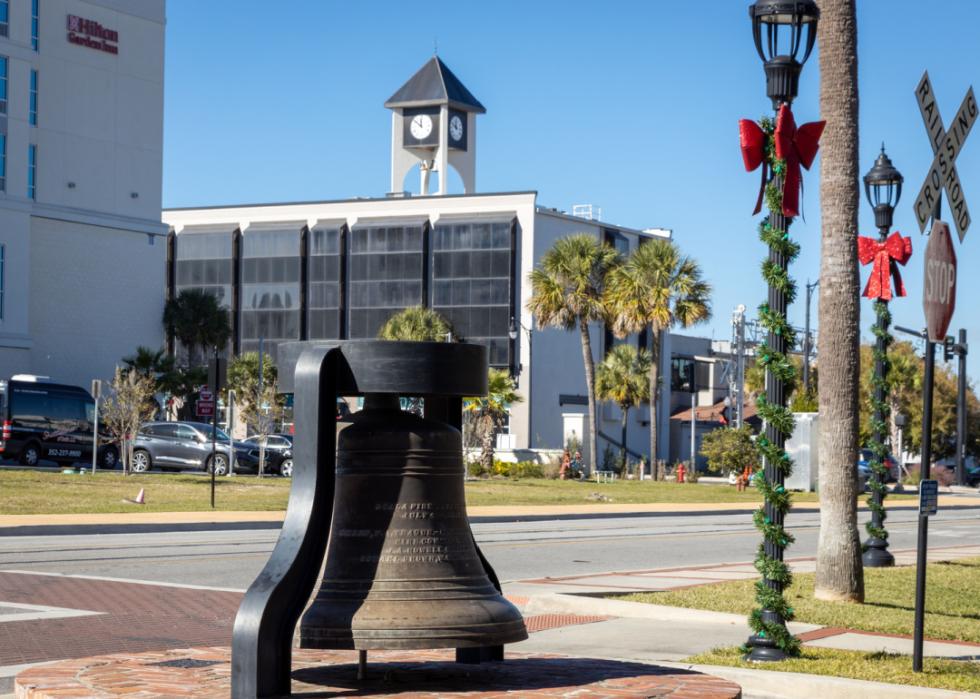
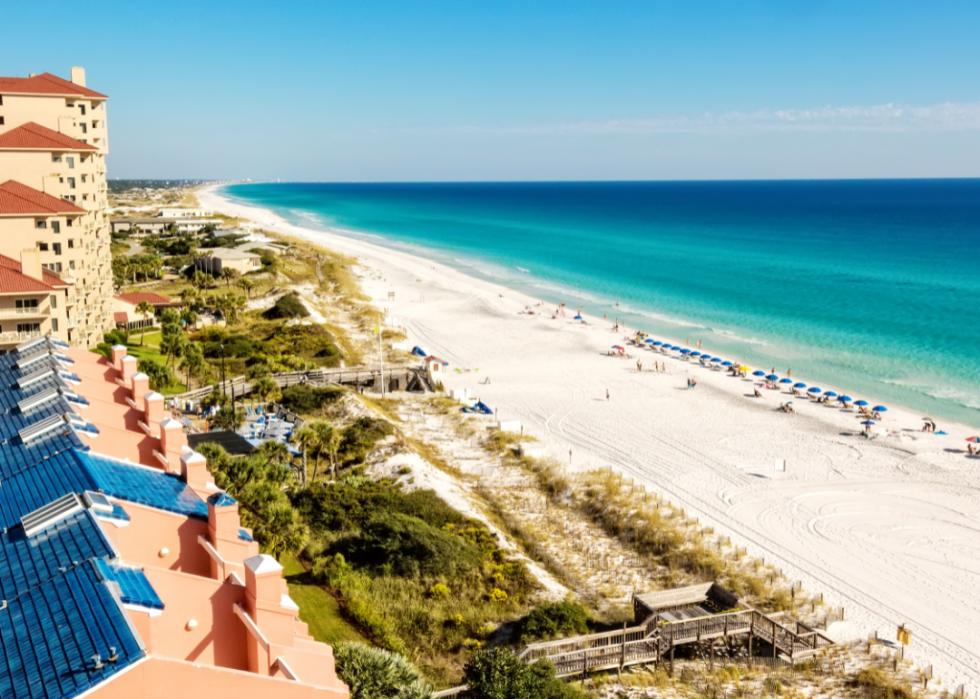
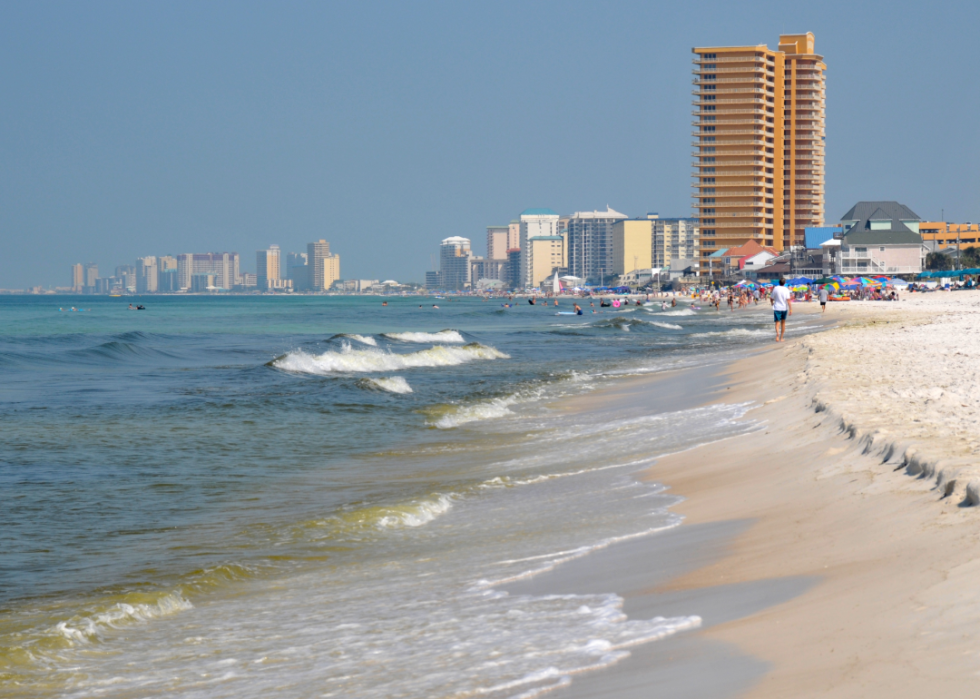
#40. Pensacola, Florida
- Average price difference: 2.4% below list
-- Median list price: $345,000
-- Median sale price: $319,428
- Total homes sold: 800
-- Share that sold above list: 13%
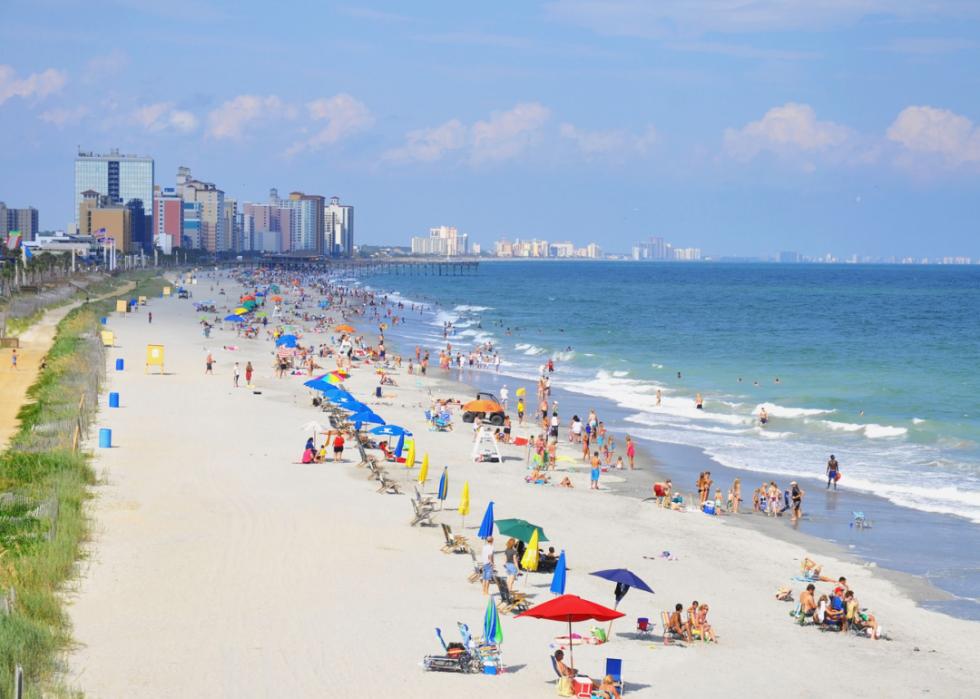
#39. Myrtle Beach, South Carolina
- Average price difference: 2.4% below list
-- Median list price: $355,000
-- Median sale price: $340,000
- Total homes sold: 1,763
-- Share that sold above list: 9%

#38. Scranton, Pennsylvania
- Average price difference: 2.4% below list
-- Median list price: $209,900
-- Median sale price: $195,000
- Total homes sold: 401
-- Share that sold above list: 28.7%

#37. Little Rock, Arkansas
- Average price difference: 2.45% below list
-- Median list price: $259,450
-- Median sale price: $230,000
- Total homes sold: 844
-- Share that sold above list: 19.3%

#36. Peoria, Illinois
- Average price difference: 2.45% below list
-- Median list price: $150,000
-- Median sale price: $140,000
- Total homes sold: 380
-- Share that sold above list: 25.5%

#35. Jacksonville, Florida
- Average price difference: 2.46% below list
-- Median list price: $400,000
-- Median sale price: $375,485
- Total homes sold: 2,502
-- Share that sold above list: 13.3%
#34. Ocala, Florida
- Average price difference: 2.47% below list
-- Median list price: $289,000
-- Median sale price: $277,995
- Total homes sold: 890
-- Share that sold above list: 15.2%

#33. San Antonio, Texas
- Average price difference: 2.48% below list
-- Median list price: $330,000
-- Median sale price: $310,000
- Total homes sold: 2,893
-- Share that sold above list: 14.2%

#32. Pittsburgh, Pennsylvania
- Average price difference: 2.56% below list
-- Median list price: $234,900
-- Median sale price: $222,750
- Total homes sold: 1,825
-- Share that sold above list: 27.3%

#31. Montgomery, Alabama
- Average price difference: 2.57% below list
-- Median list price: $267,597
-- Median sale price: $231,756
- Total homes sold: 390
-- Share that sold above list: 15.4%
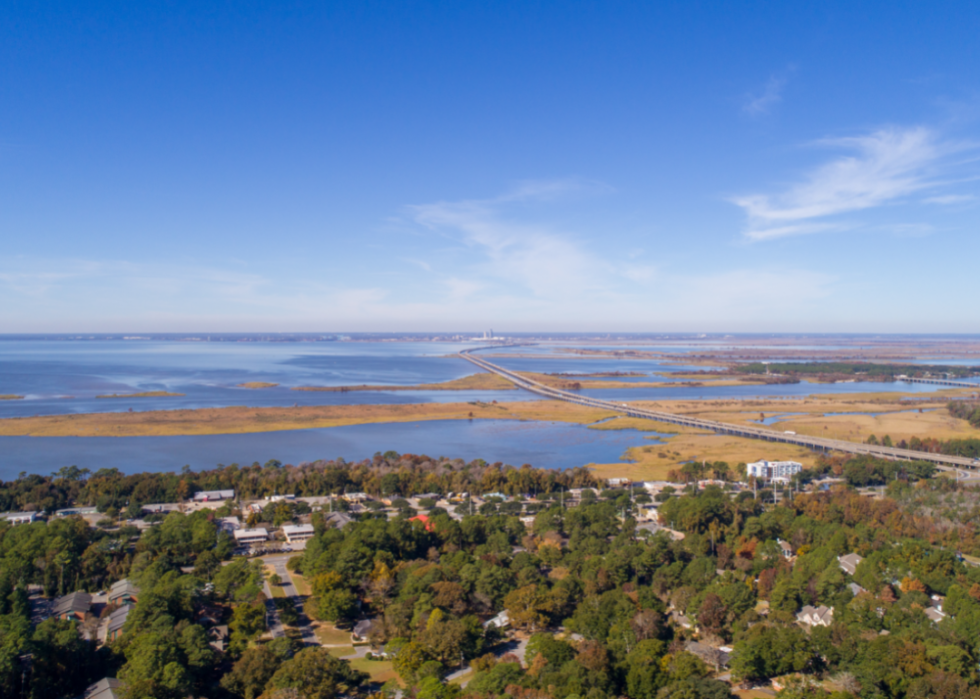
#30. Daphne, Alabama
- Average price difference: 2.6% below list
-- Median list price: $434,950
-- Median sale price: $360,000
- Total homes sold: 570
-- Share that sold above list: 6.7%

#29. Tampa, Florida
- Average price difference: 2.6% below list
-- Median list price: $399,000
-- Median sale price: $370,000
- Total homes sold: 5,139
-- Share that sold above list: 13%
#28. Crestview, Florida
- Average price difference: 2.61% below list
-- Median list price: $539,250
-- Median sale price: $400,000
- Total homes sold: 692
-- Share that sold above list: 11%

#27. Houston, Texas
- Average price difference: 2.71% below list
-- Median list price: $362,787
-- Median sale price: $330,000
- Total homes sold: 7,312
-- Share that sold above list: 14.3%

#26. Prescott Valley, Arizona
- Average price difference: 2.73% below list
-- Median list price: $650,000
-- Median sale price: $539,000
- Total homes sold: 301
-- Share that sold above list: 10.6%

#25. South Bend, Indiana
- Average price difference: 2.81% below list
-- Median list price: $212,500
-- Median sale price: $181,250
- Total homes sold: 314
-- Share that sold above list: 22.9%

#24. Memphis, Tennessee
- Average price difference: 2.81% below list
-- Median list price: $305,000
-- Median sale price: $275,000
- Total homes sold: 1,192
-- Share that sold above list: 20.1%
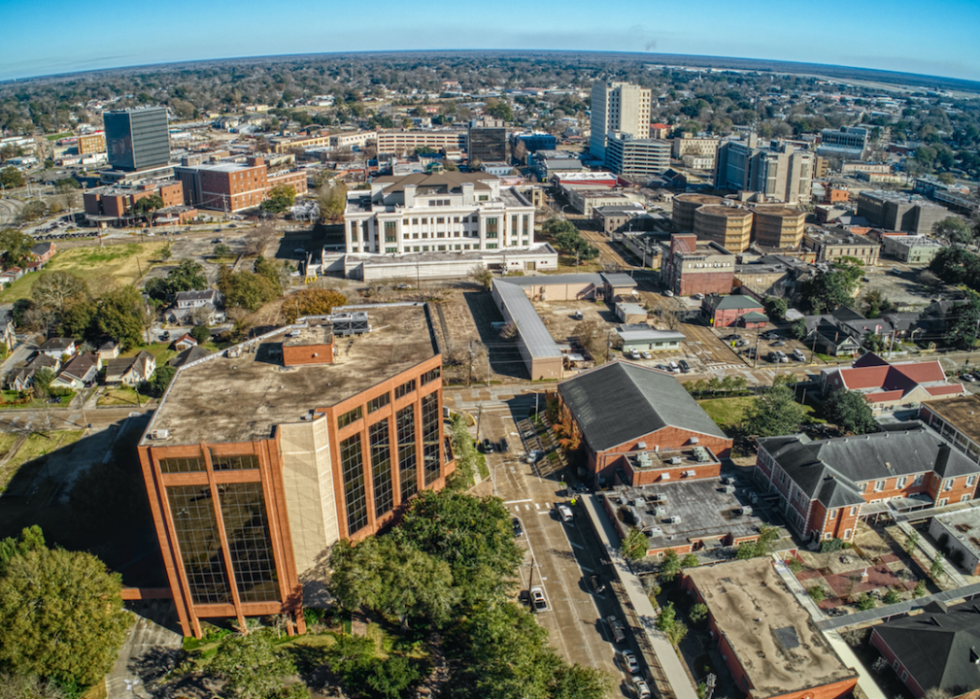
#23. Lafayette, Louisiana
- Average price difference: 2.86% below list
-- Median list price: $243,355
-- Median sale price: $230,000
- Total homes sold: 393
-- Share that sold above list: 10.7%
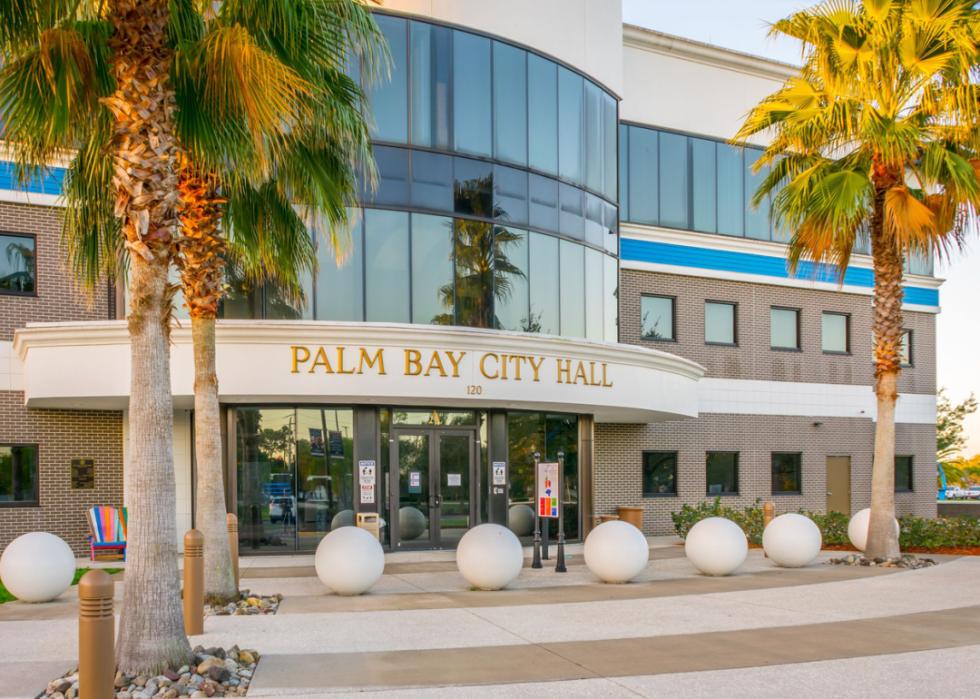
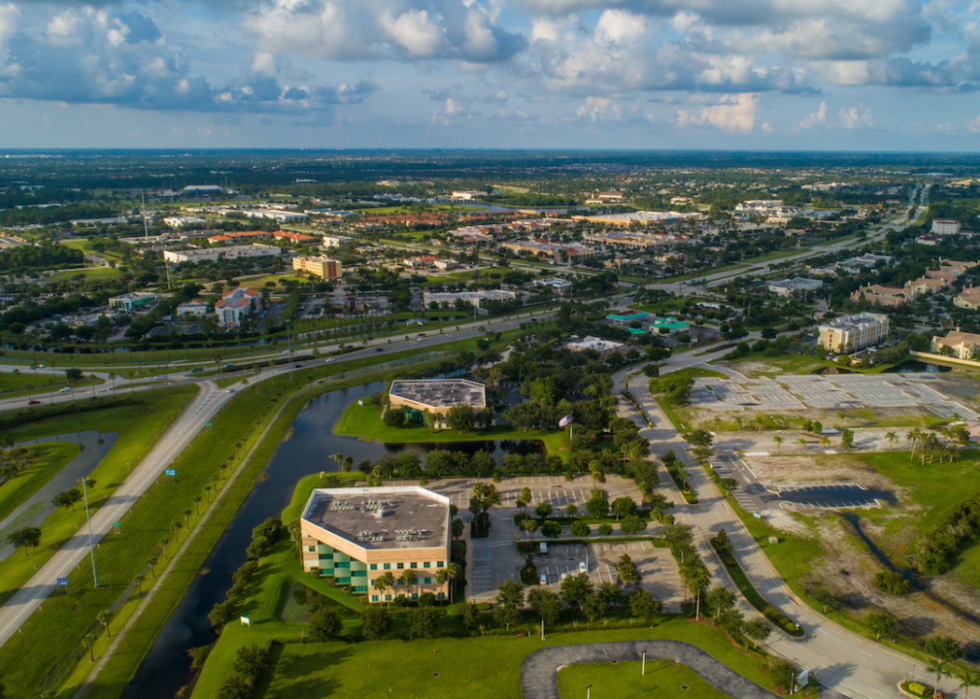
#22. Palm Bay, Florida
- Average price difference: 2.89% below list
-- Median list price: $387,260
-- Median sale price: $361,750
- Total homes sold: 1,099
-- Share that sold above list: 9.7%
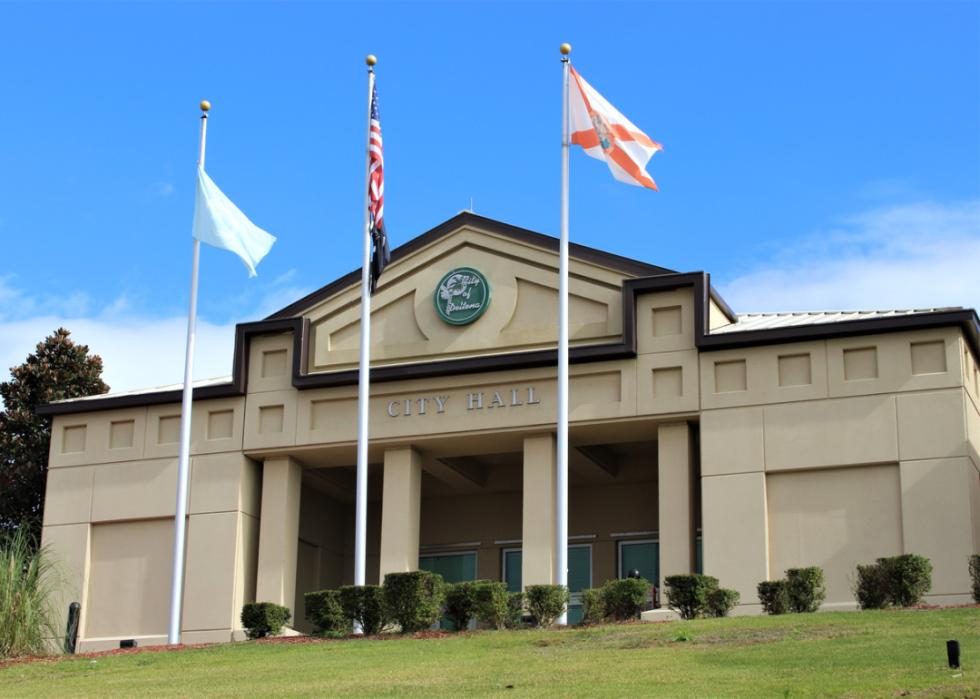
#21. Deltona, Florida
- Average price difference: 2.98% below list
-- Median list price: $375,000
-- Median sale price: $356,090
- Total homes sold: 1,349
-- Share that sold above list: 10%

#20. Gainesville, Florida
- Average price difference: 3.01% below list
-- Median list price: $329,900
-- Median sale price: $305,000
- Total homes sold: 337
-- Share that sold above list: 13.4%

#19. Mobile, Alabama
- Average price difference: 3.02% below list
-- Median list price: $233,253
-- Median sale price: $215,000
- Total homes sold: 407
-- Share that sold above list: 21.9%

#18. Kingsport, Tennessee
- Average price difference: 3.02% below list
-- Median list price: $277,000
-- Median sale price: $250,160
- Total homes sold: 313
-- Share that sold above list: 20.8%
#17. Panama City, Florida
- Average price difference: 3.03% below list
-- Median list price: $430,000
-- Median sale price: $350,000
- Total homes sold: 400
-- Share that sold above list: 8.5%
#16. Port St. Lucie, Florida
- Average price difference: 3.06% below list
-- Median list price: $435,000
-- Median sale price: $396,000
- Total homes sold: 961
-- Share that sold above list: 11.3%
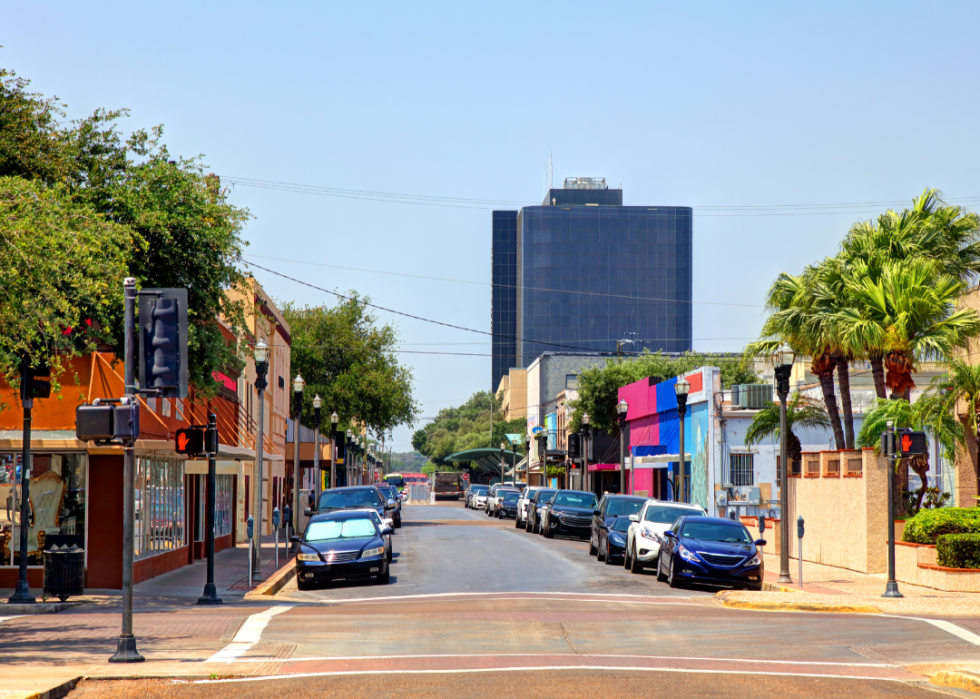
#15. McAllen, Texas
- Average price difference: 3.12% below list
-- Median list price: $275,000
-- Median sale price: $240,000
- Total homes sold: 364
-- Share that sold above list: 18.1%
#14. North Port, Florida
- Average price difference: 3.29% below list
-- Median list price: $472,900
-- Median sale price: $445,000
- Total homes sold: 2,281
-- Share that sold above list: 6.8%

#13. Youngstown, Ohio
- Average price difference: 3.32% below list
-- Median list price: $175,000
-- Median sale price: $148,000
- Total homes sold: 419
-- Share that sold above list: 26%

#12. Gulfport, Mississippi
- Average price difference: 3.42% below list
-- Median list price: $255,000
-- Median sale price: $244,950
- Total homes sold: 456
-- Share that sold above list: 9.6%

#11. Shreveport, Louisiana
- Average price difference: 3.45% below list
-- Median list price: $235,000
-- Median sale price: $220,600
- Total homes sold: 341
-- Share that sold above list: 14.4%
#10. Cape Coral, Florida
- Average price difference: 3.51% below list
-- Median list price: $430,000
-- Median sale price: $405,450
- Total homes sold: 1,992
-- Share that sold above list: 8.2%
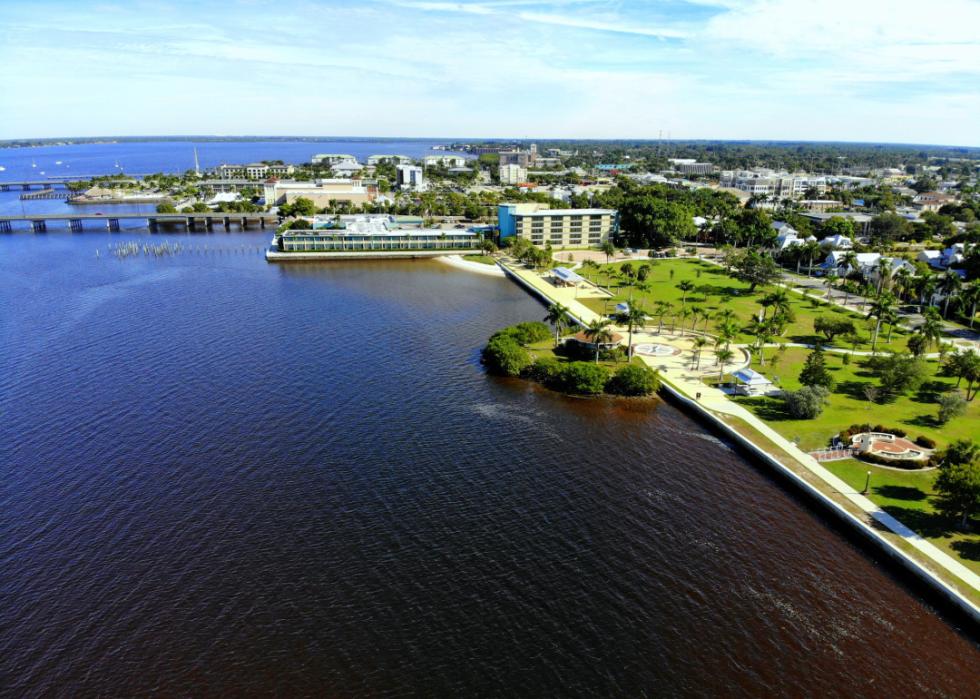
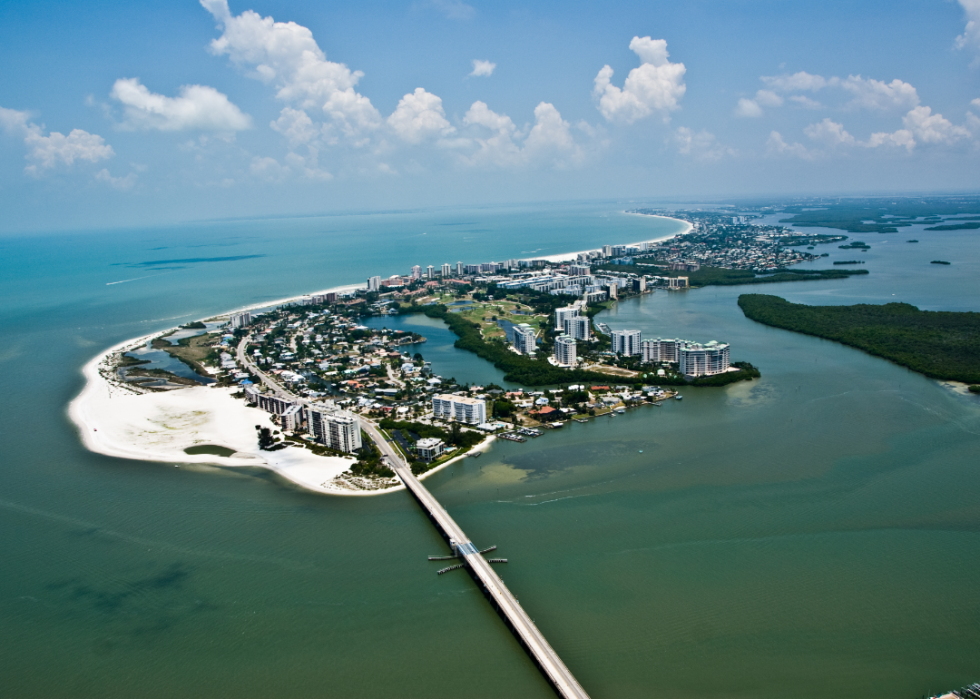
#9. Punta Gorda, Florida
- Average price difference: 3.52% below list
-- Median list price: $372,990
-- Median sale price: $355,000
- Total homes sold: 656
-- Share that sold above list: 7.5%

#8. Jackson, Mississippi
- Average price difference: 3.59% below list
-- Median list price: $267,500
-- Median sale price: $249,900
- Total homes sold: 447
-- Share that sold above list: 13%
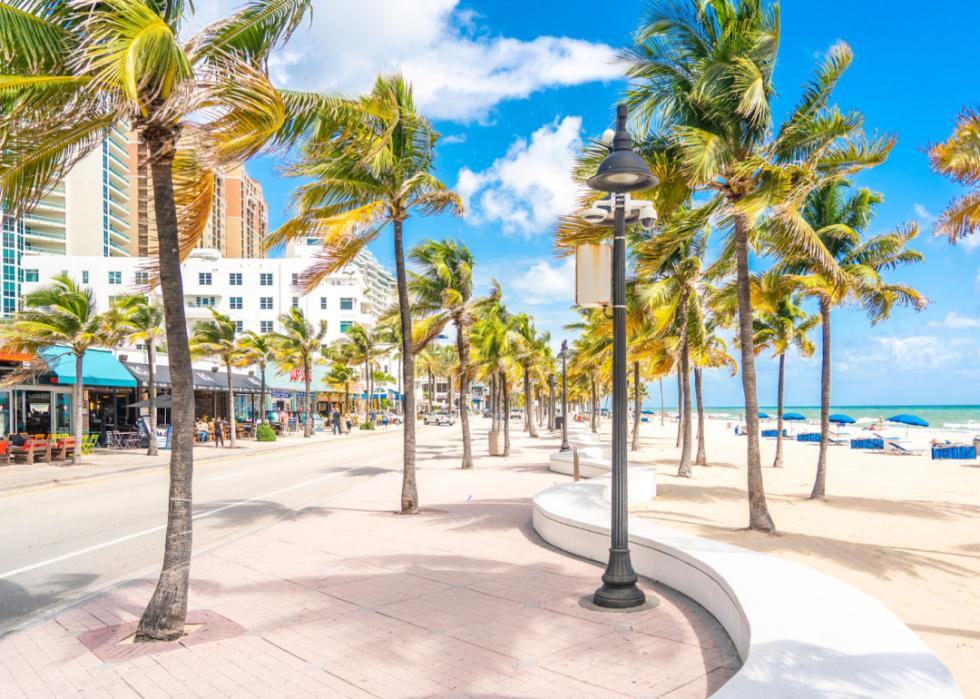
#7. Fort Lauderdale, Florida
- Average price difference: 3.64% below list
-- Median list price: $440,000
-- Median sale price: $450,000
- Total homes sold: 2,404
-- Share that sold above list: 10.9%

#6. New Orleans, Louisiana
- Average price difference: 3.68% below list
-- Median list price: $329,000
-- Median sale price: $285,000
- Total homes sold: 941
-- Share that sold above list: 13.9%

#5. Miami, Florida
- Average price difference: 3.93% below list
-- Median list price: $575,000
-- Median sale price: $560,000
- Total homes sold: 2,320
-- Share that sold above list: 12.2%
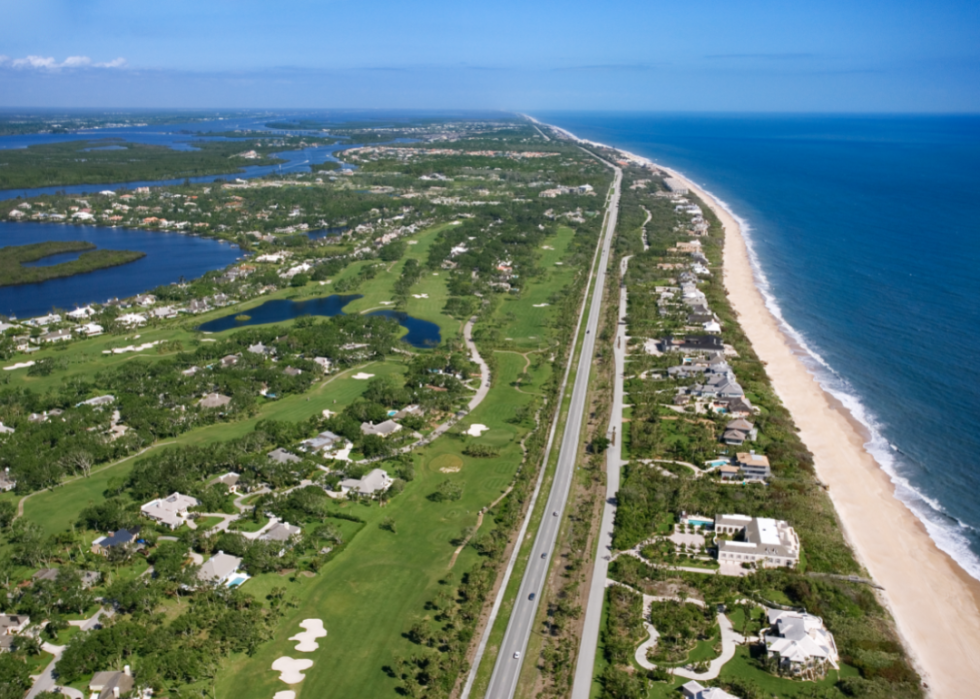
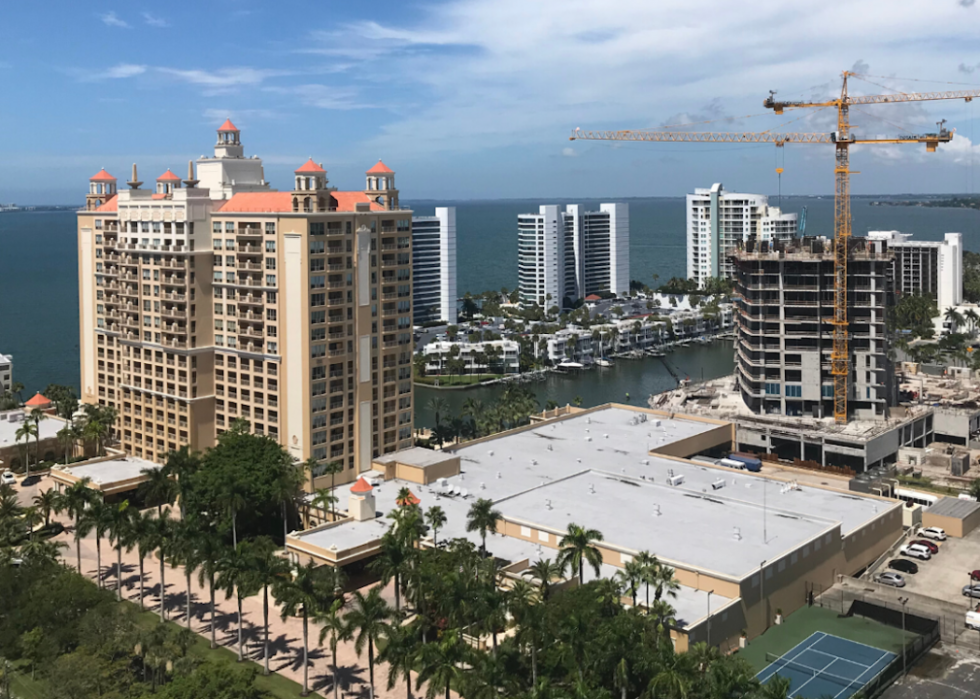
#4. Sebastian, Florida
- Average price difference: 4.03% below list
-- Median list price: $409,950
-- Median sale price: $420,000
- Total homes sold: 328
-- Share that sold above list: 7.6%
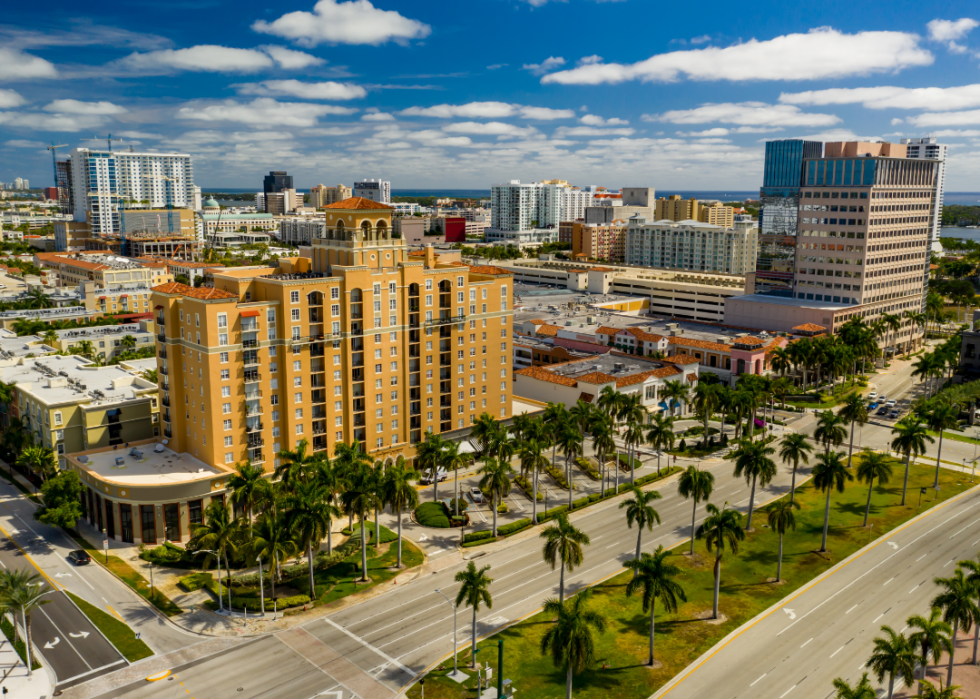
#3. West Palm Beach, Florida
- Average price difference: 4.41% below list
-- Median list price: $500,000
-- Median sale price: $515,000
- Total homes sold: 2,289
-- Share that sold above list: 7.9%
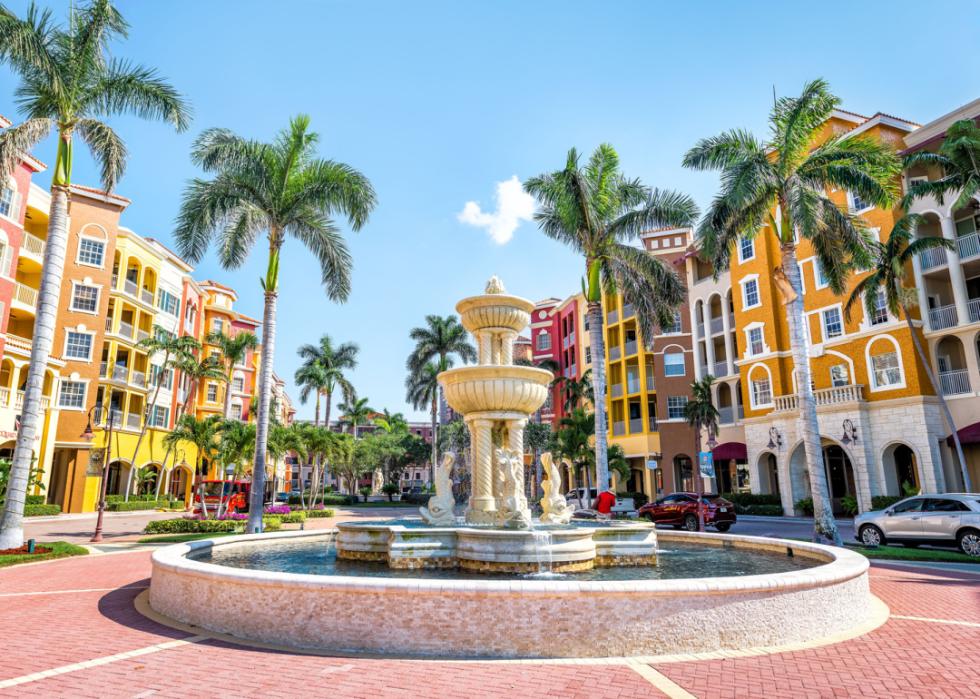
#2. Naples, Florida
- Average price difference: 4.51% below list
-- Median list price: $749,000
-- Median sale price: $680,000
- Total homes sold: 989
-- Share that sold above list: 5.8%

#1. Springfield, Missouri
- Average price difference: 15.84% below list
-- Median list price: $295,000
-- Median sale price: $262,250
- Total homes sold: 508
-- Share that sold above list: 0.2%


