
Most conservative county in states with the highest percentage of liberals
Most conservative county in states with the highest percentage of liberals
American politics have polarized faster than in other democracies, according to a report published in the National Bureau of Economic Research. This trend is reflected in the ideological movement of the U.S. Congress, with both Democrats and Republicans moving further and further away from an ideological center, though Republicans have done so on average more intensely. Indeed, the recent struggle of Republican House Majority Leader Kevin McCarthy to gain the speakership role highlighted the degree to which hard-right conservative politicians have come to hold disproportionately large sway over the Republican majority.
With the 2024 presidential primaries beginning to ramp up, everyone will soon be talking about "red" states and "blue" states . But coloring in an entire state based on the party that tends to prevail there in statewide elections obscures a lot of political diversity. In most states, there are neighborhoods, towns, and counties that hold steadfast against their neighbors and vote for the party that holds an opposing ideology to a majority of the state's residents.
To develop an understanding of the complexity of the American political landscape, Stacker compiled voter turnout data from the New York Times and statewide political ideology data from Gallup to rank states by their share of self-identifying liberals. Ties were broken by the corresponding percentage of conservatives, as able. Voter data was then used to identify counties within these states with the highest percentage of self-identifying conservatives.
In looking at these counties, data from government agencies such as the Census Bureau and research institutes—such as the Pew Research Center and the Public Religion Research Institute—were used to highlight and analyze demographic factors that might make the political ideology of the county apparent. Percentages of people identifying as "white Christian" in each county were sourced from the 2020 Census of American Religion. Detailed voter turnout data was unavailable for Virginia, Alaska, Louisiana, and Alabama.
Self-described ideology, like Gallup's, is just one way to measure a person or group's politics, of course. Vote choice is another. You could also look at party affiliation, for example, and your list might look different. In many states in the South, for instance, Black voters are the majority of Democratic voters. And – looking at vote choice – there are pockets of deep blue in otherwise ruby-red states. But Black voters are far less likely than white voters to call themselves "liberal."
In terms of understanding how these demographic factors affect the political lean of an American voter, a few qualities stand out as the biggest and most reliable predictors of party affiliation and ideological tendency. Namely, religion, race, education, and where a voter falls on the urban-rural divide. To distill these complexities into a couple of takeaways: Racially diverse communities lean Democrat by wide margins, and white Christians account for a large percentage of Republican votes. The highly educated tend to lean Democrat quite broadly, and in presidential elections, rural areas see a 15-22 point increase in Republican votes regardless of other variables such as race and education. Gender, age, and sexuality all play into the equation as well, with older voters leaning conservative, women leaning Democrat, men leaning slightly Republican, and LGBTQ+ voters overwhelmingly liberal.
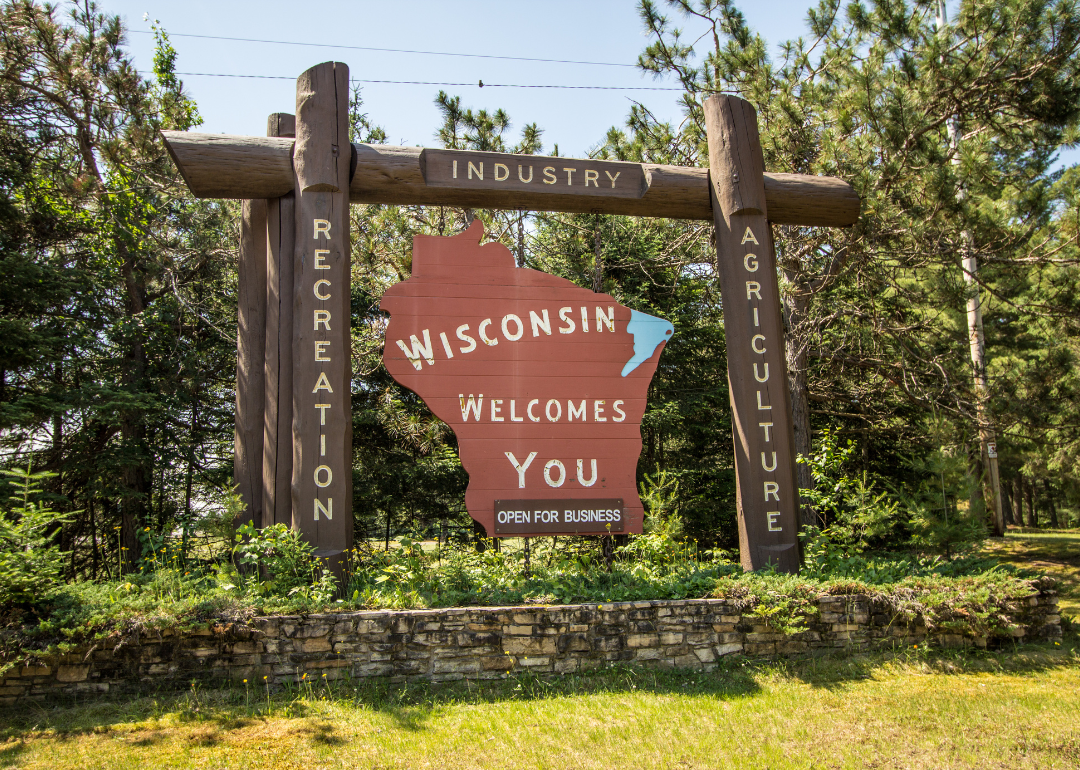
#20. Wisconsin: 24% liberal, 35% conservative
- Most conservative county: Florence County
--- Republican votes in 2020: 2,133 (72.6%)
--- Total votes cast: 2,940
Located on the northernmost, rural border between Wisconsin and Michigan, Florence County has a population of 4,558, of which 94.6% is white, most of whom identify as white and Christian. The county has a population density of 9.3 people per square mile, a median age 15.9 years higher than the national average of 38.6, and 20.6% of its population has attained a bachelor's degree or higher, 14.4% lower than the national average of 35%.
#19. Pennsylvania: 24% liberal, 34% conservative
- Most conservative county: Fulton County
--- Republican votes in 2020: 6,824 (85.4%)
--- Total votes cast: 7,990
Fulton County shares a border with Maryland to the south and is sparsely populated, with McConnellsburg (population 1,150) its largest town. In terms of explaining conservative dominance in the county, three demographics stand out: its population of 14,556 is 94.3% white, only 15.7% of residents have a bachelor's degree or higher, and 80% of the population identifies as white Christian.
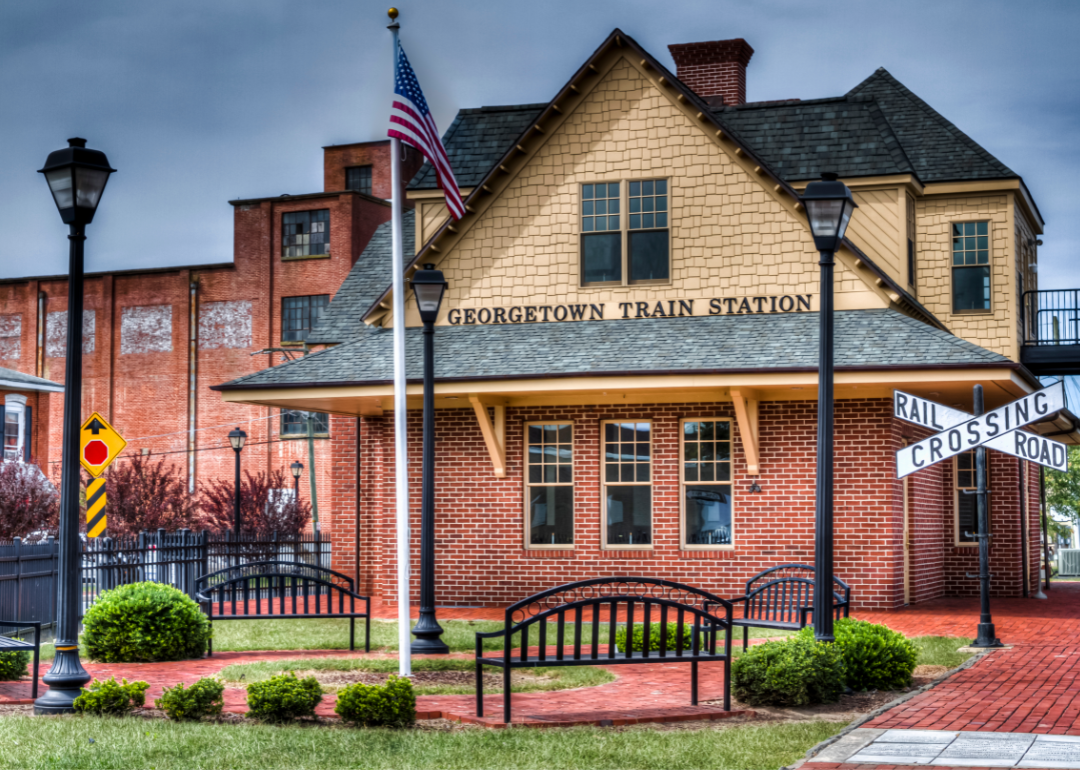
#18. Delaware: 24% liberal, 29% conservative
- Most conservative county: Sussex County
--- Republican votes in 2020: 71,230 (55.1%)
--- Total votes cast: 129,352
Distinguishing Sussex County most significantly from its more liberal neighboring counties is the high median age of its residents at 51.8 years, with 29.8% of Sussex County residents being 65 and older, and 75.4% of its 237,378 residents identifying as white. Immediately north is Kent County, Delaware, which has a median age of 38.8, and a lower percentage of white residents at 58.8% of 181,851. While not as markedly white as other counties, Sussex's racial demographics, combined with the fact that older voters generally vote more conservatively, likely contribute to its Republican lean.
#17. Minnesota: 25% liberal, 32% conservative
- Most conservative county: Morrison County
--- Republican votes in 2020: 14,821 (75.8%)
--- Total votes cast: 19,558
One of the top counties in Minnesota for dairy farming, Morrison County has a population of 34,010 with a density of 29.5 people per square mile, making it a decidedly rural region. In terms of demographics, the county is 94.2% white, a recurring factor in sharply conservative counties.
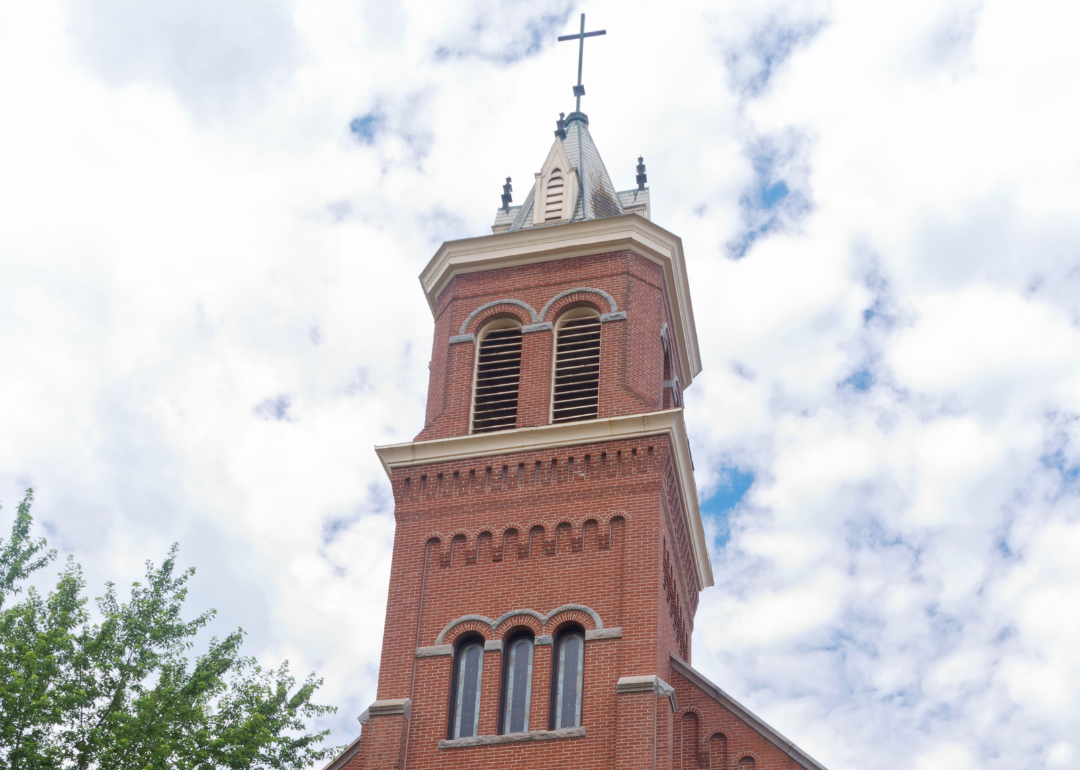
#16. Rhode Island: 25% liberal, 29% conservative
- Most conservative county: Kent County
--- Republican votes in 2020: 42,001 (45.1%)
--- Total votes cast: 93,093
Demographically, Kent County is fairly average, containing parts of the greater Providence metropolitan area as well as rural swaths, and with income, employment, education, and median age levels on par with the national average. The county's tossup nature is reflected in its voting history, going for President Trump by a 0.7% margin in 2016 and President Biden by a 7.6% margin in 2020. Likely tipping the county's balance towards conservatism, however, are the 38% of its population identifying as white Catholics, a group that leans Republican by a 14% margin, as well as a largely white overall population representing 86% of the total 170,363 residents.
#15. Colorado: 26% liberal, 33% conservative
- Most conservative county: Kiowa County
--- Republican votes in 2020: 795 (88.0%)
--- Total votes cast: 903
The location of a collapsed agriculture industry, Kiowa County is 1,767.8 square miles, but contains only 1,446 residents, making it one of the top 50 least densely populated counties in the nation. With a population that is 75% white and Christian, and overall 89% white, Kiowa's steep conservatism likely comes down to its racial and geographic demographic qualities.
#14. Illinois: 27% liberal, 31% conservative
- Most conservative county: Wayne County
--- Republican votes in 2020: 7,176 (84.4%)
--- Total votes cast: 8,499
Wayne County is host to 368,017 acres of farmland, constituting 80% of the county's 713.8 square miles. Its largest city is Fairfield with a population of 4,883. Eighty-two percent of the county's population of 16,179 are white Christians, and 95.5% of the overall population is white, with the percentage of the population attaining a bachelor's degree or higher at 15.2%, about 20 points lower than the national average.
#13. Connecticut: 27% liberal, 30% conservative
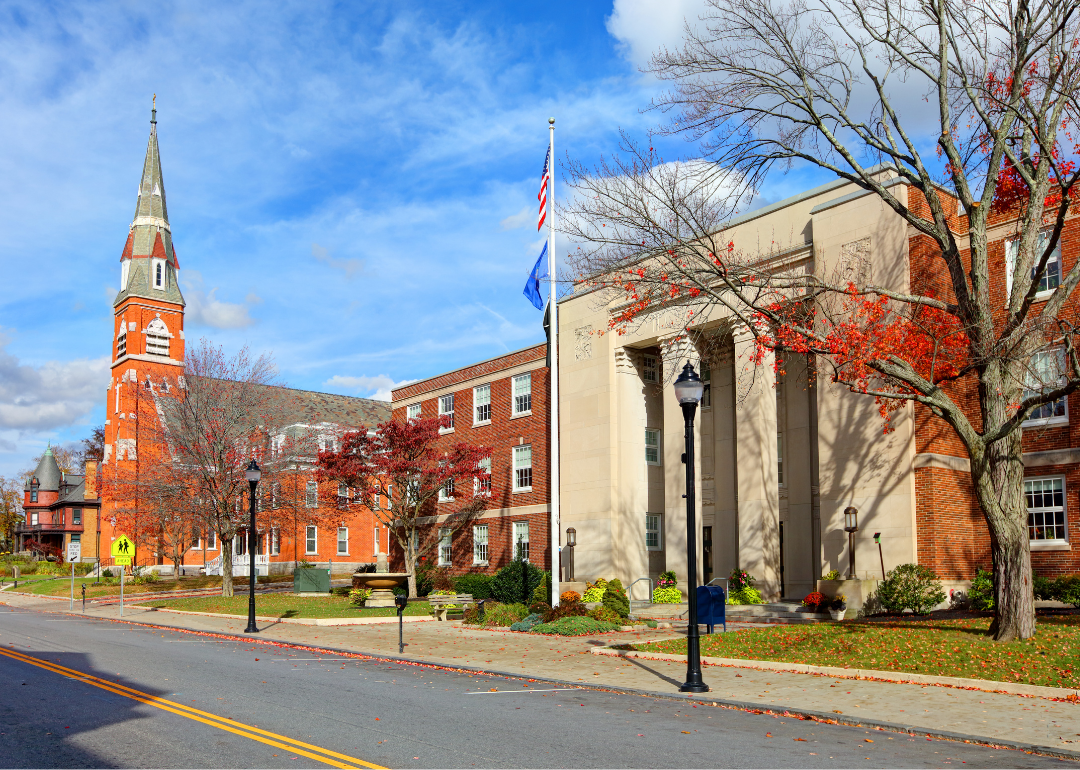
- Most conservative county: Litchfield County
--- Republican votes in 2020: 55,601 (51.7%)
--- Total votes cast: 107,544
Connecticut's largest county by square mileage, Litchfield County has a population of 185,186 and contains a consistent distribution of smaller towns interspersed with natural areas and preserves. The county is wealthier than the national average, with a median household income of $84,978 against the nation's $69,717, and more highly educated with 38% of the population attaining a bachelor's degree or higher and 15% attaining a postgraduate or professional degree. Factors contributing to the county's tendency to go for Republican candidates by small but consistent margins are a high median age of 47.6, a population of 85.7% white, and 5% white Christian.
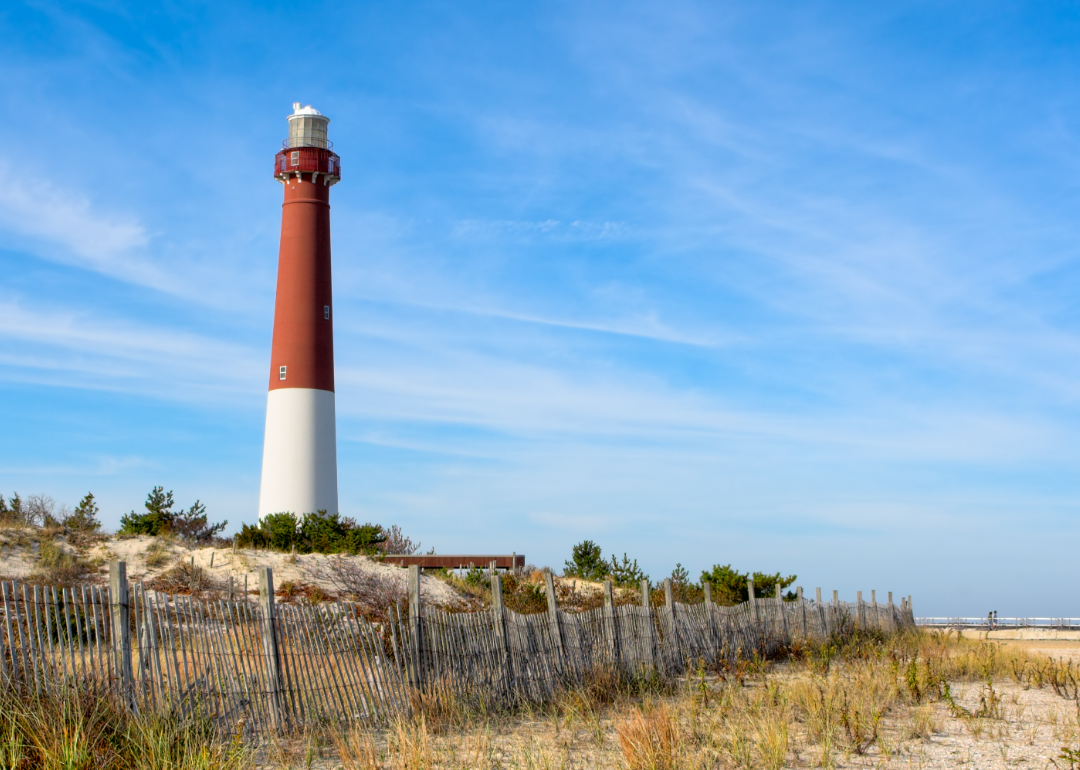
#12. New Jersey: 27% liberal, 29% conservative
- Most conservative county: Ocean County
--- Republican votes in 2020: 217,740 (63.8%)
--- Total votes cast: 341,516
Part of the broader New York metropolitan area, Ocean County is home to 637,229 people and has grown consistently over the decades, gaining 10.5% in population from 2010-2020. The city of Lakewood is a source of much of that increase, growing by 45.6% to a total population of 135,158 from 2010-2020, thanks in large part to an influx of Orthodox Jewish people, a group that leans Republican by 75%. Otherwise, the county's population is 83.8% white, with 10.4% of the population being Hispanic or Latino, and overall has fairly average income, education, and median age demographics.

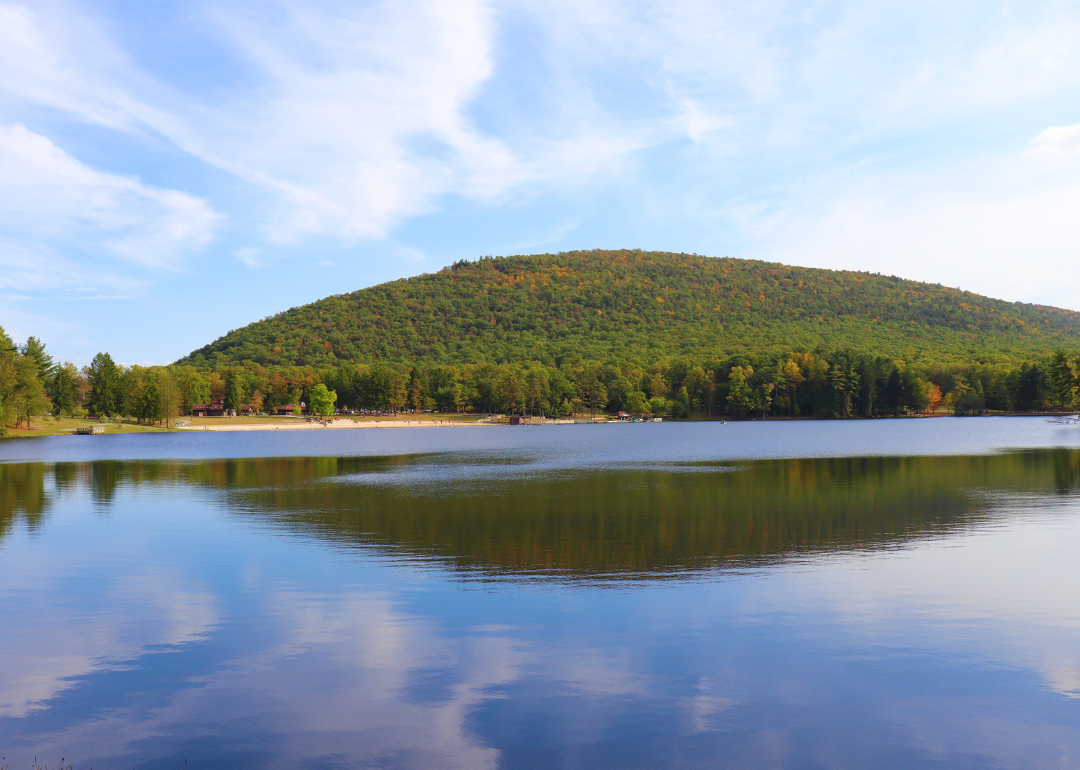
#11. Oregon: 28% liberal, 32% conservative
- Most conservative county: Lake County
--- Republican votes in 2020: 3,470 (79.5%)
--- Total votes cast: 4,363
Located in southern Oregon in a region known as the "Oregon Outback" for its desert habitat, Lake County is 8,138.6 square miles in size and contains a population of 8,160, putting its population density at about 1 person per square mile. A quarter of the population is 65 years and older, and 82% are white with an overall median household income of $50,685, about $20,000 lower than national and state levels.
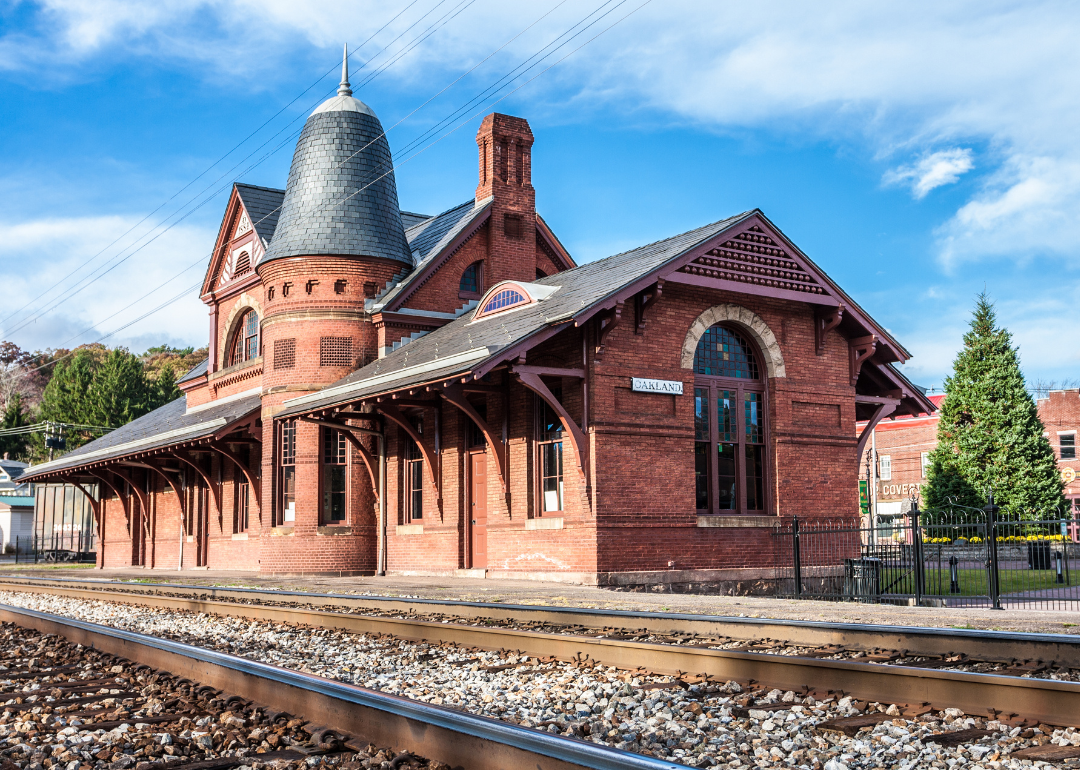
#10. Maryland: 28% liberal, 29% conservative
- Most conservative county: Garrett County
--- Republican votes in 2020: 12,002 (76.9%)
--- Total votes cast: 15,611
Maryland's westernmost county, Garrett County is sandwiched between West Virginia and Pennsylvania and contains 118.75 square miles of parks, lakes, and forestland—about 18% of the county's overall size. The county is overwhelmingly white at 96.5% of 28,806 people and is 71% white Christian, with 23% of residents religiously unaffiliated. The county has a slightly above average median age of 47.3, with 22.4% of the population 65 and older, a median income of $58,011 against the state's $90,203, and 24.7% of residents having attained a bachelor's degree or higher.
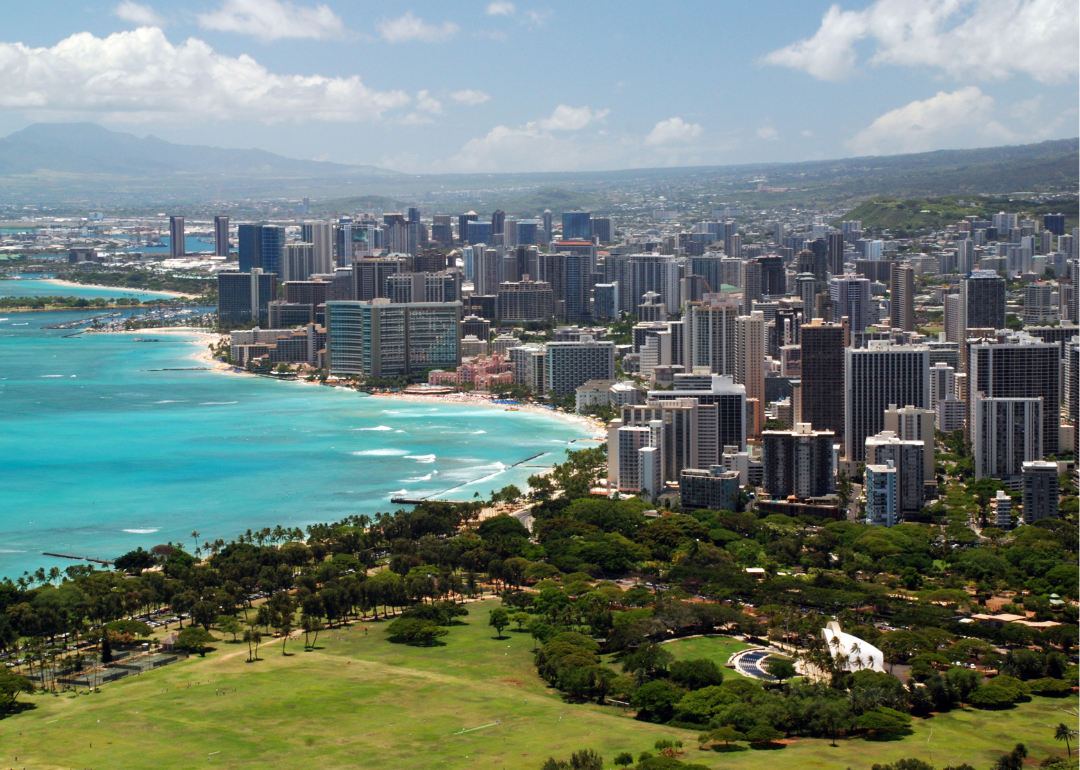
#9. Hawaii: 28% liberal, 22% conservative
- Most conservative county: Honolulu County
--- Republican votes in 2020: 136,259 (35.7%)
--- Total votes cast: 382,114
Containing 70% of Hawaii's residents and encompassing the entirety of the island of Honolulu, Honolulu County has a population of 1,016,508, 43% of whom are Asian or Asian American, 10% of whom are Native Hawaiian and Pacific Islander, and 18.5% of whom are white. In terms of political affiliation, English-speaking Asian Americans lean Democrat by a margin of 55 points, a gap that has continually widened over the last two decades. Religiously, the county is quite diverse—4% of its population is Buddhists, the third-largest concentration of Buddhists in the nation, a group that leans Democrat.
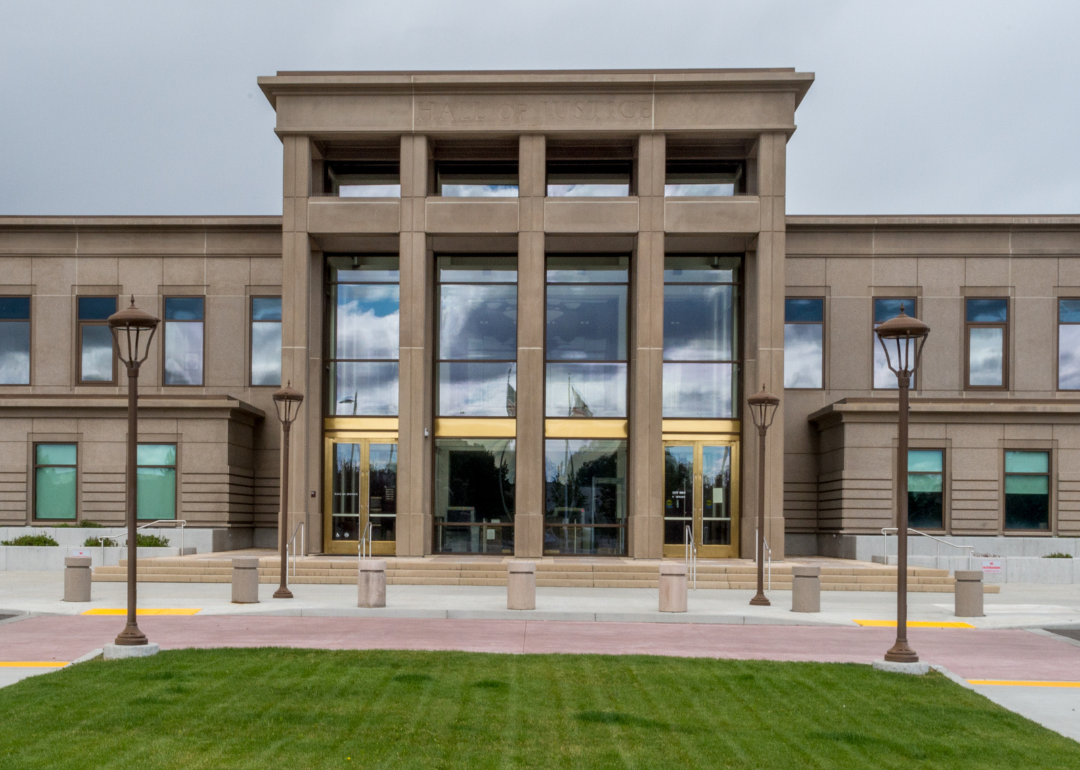
#8. California: 29% liberal, 29% conservative
- Most conservative county: Lassen County
--- Republican votes in 2020: 8,970 (74.8%)
--- Total votes cast: 11,985
Located in California's arid northeast, Lassen County has a low employment rate of 30%, though the population's median age is 37.3. Notably, 46% of people employed in the county are local, state, and federal government employees—31.4% higher than the national average—with state and federal prisons located in the region accounting for a significant amount of that number. Only 11.8% of the population has attained a bachelor's degree or higher. The county is relatively diverse when compared to other counties on this list with 64.3% of the population identifying as white, 23% as Hispanic or Latino, 6.9% as Black or African American, and 3.3% as American Indian/Alaskan Native.
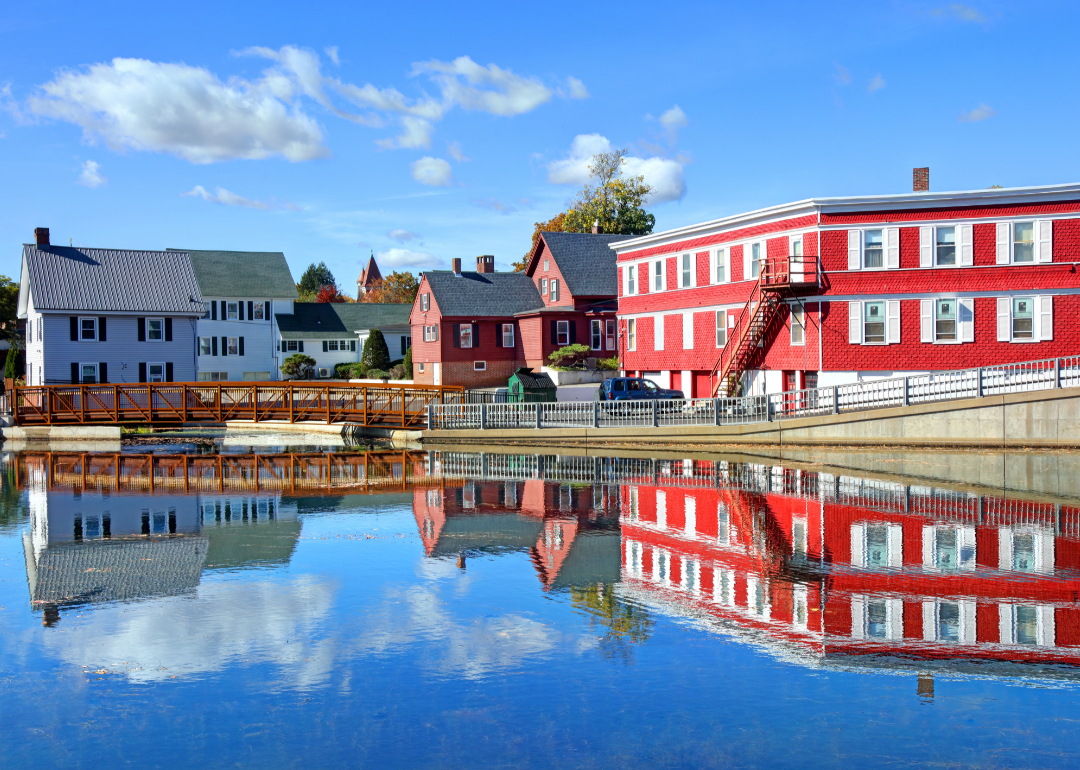
#7. New Hampshire: 30% liberal, 28% conservative
- Most conservative county: Belknap County
--- Republican votes in 2020: 20,899 (54.3%)
--- Total votes cast: 38,453
Host to the majority of Lake Winnipesaukee, 15% of Belknap County's area is water, and its largest city is Laconia, which has a population of 16,871 to the county's 63,705 residents. Significant to the politics of the region is a popular ski resort called Gunstock, which in 2023 led to an upheaval in the county's state delegation after a Republican-led group attempted to usher in corporate ownership of the resort. In terms of its demographics, Belknap contains the highest concentration of white Christians in New Hampshire at 63%, with 92.8% of the overall population identifying as white.
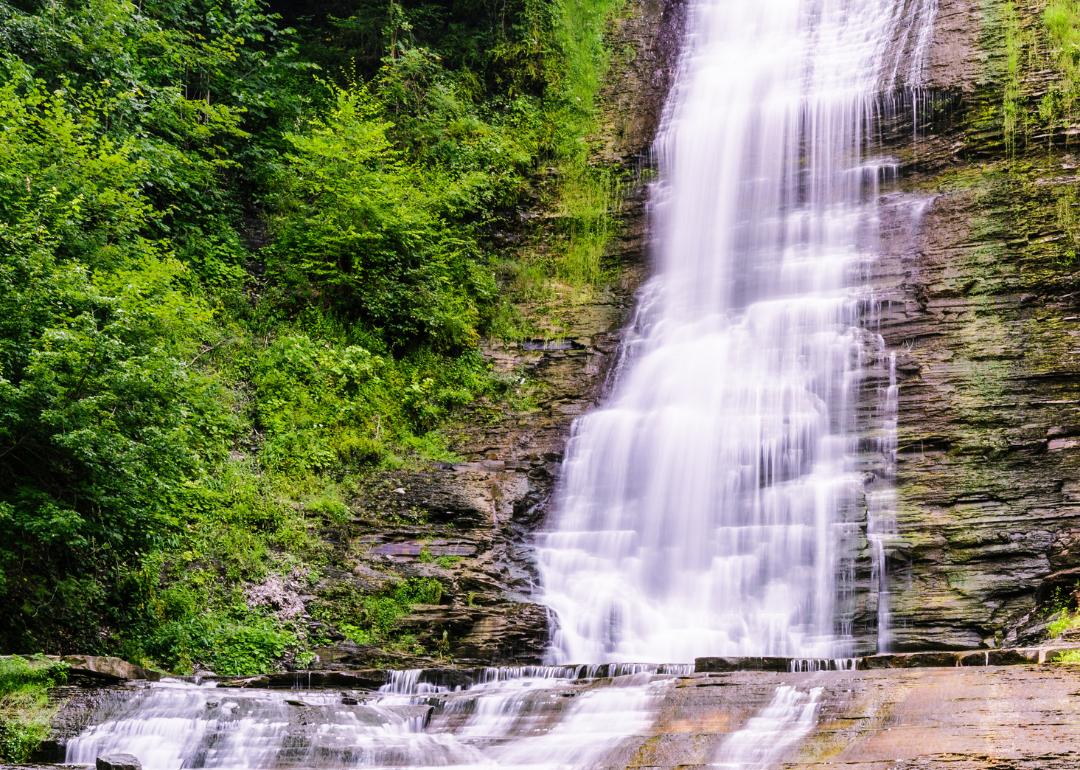
#6. New York: 30% liberal, 27% conservative
- Most conservative county: Wyoming County
--- Republican votes in 2020: 13,348 (74.0%)
--- Total votes cast: 18,050
Located in far western New York, Wyoming County is the state's largest dairy farming county, containing an estimated 49,925 cows, per the USDA's 2017 Census of Agriculture. The county also contains the third-highest concentration of white Christians in the state at 67% of the population and of that 22% are white evangelical Protestants, a group that leans Republican by a margin of 59 points.
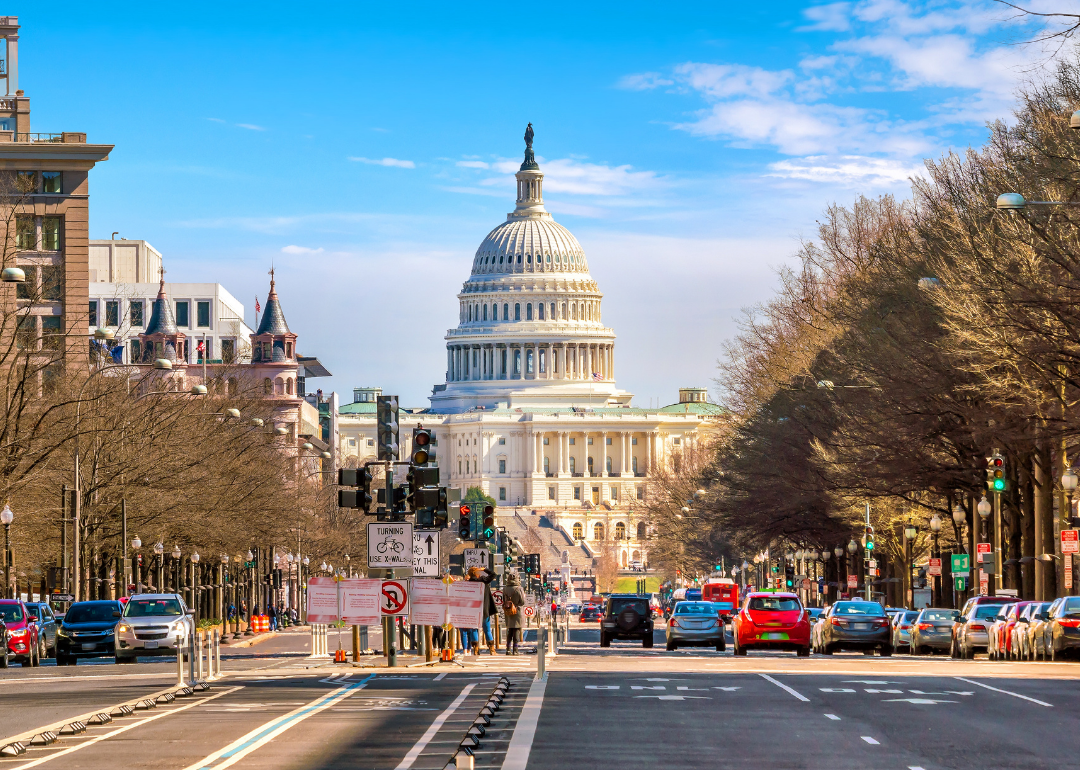
#5. Washington D.C.: 30% liberal, 24% conservative
- Most conservative county: Washington
--- Republican votes in 2020: 18,586 (5.4%)
--- Total votes cast: 344,356
As a federal district and not a state, Washington D.C. does not contain any official counties, but its local government performs the services of a city and county. A region that votes overwhelmingly Democratic and has since at least 1964, D.C.'s conservatism is difficult to identify. Notably, 63% of D.C. residents have attained a bachelor's degree or higher and 35.9% have attained a graduate or professional degree. The region is also very diverse with a population of 689,545 breaking down to 41.4% Black or African American, 39.6% white, 11.3% Hispanic or Latino, and 4.8% Asian.
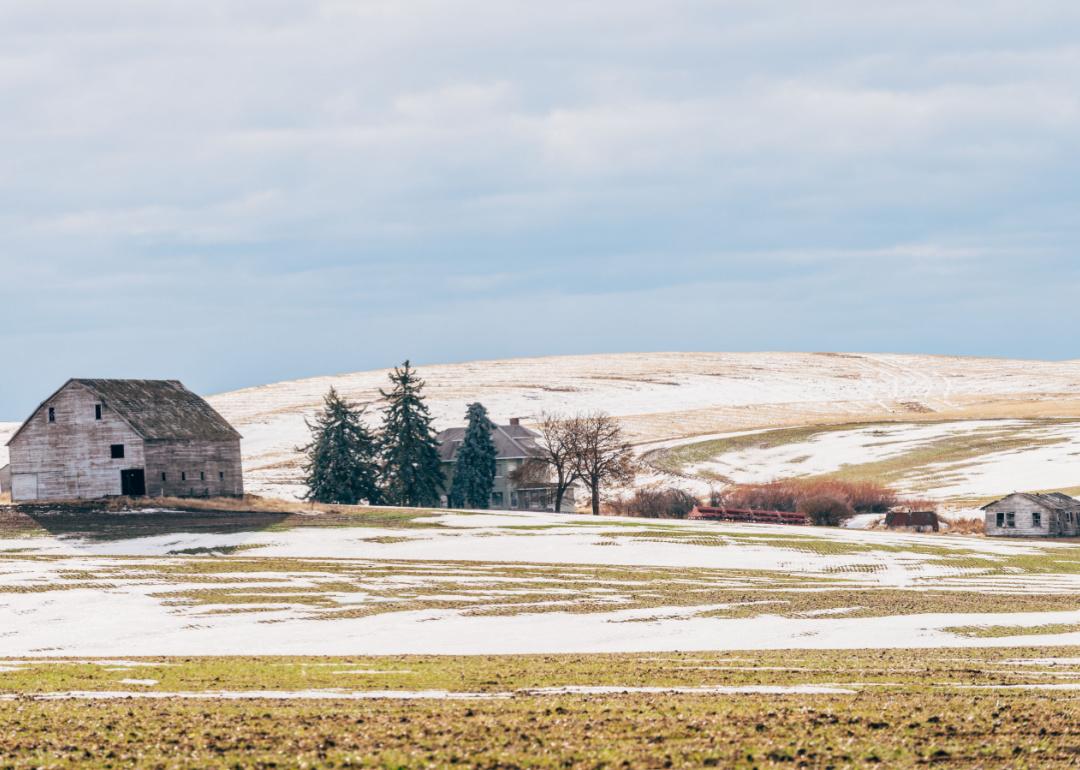
#4. Washington: 31% liberal, 28% conservative
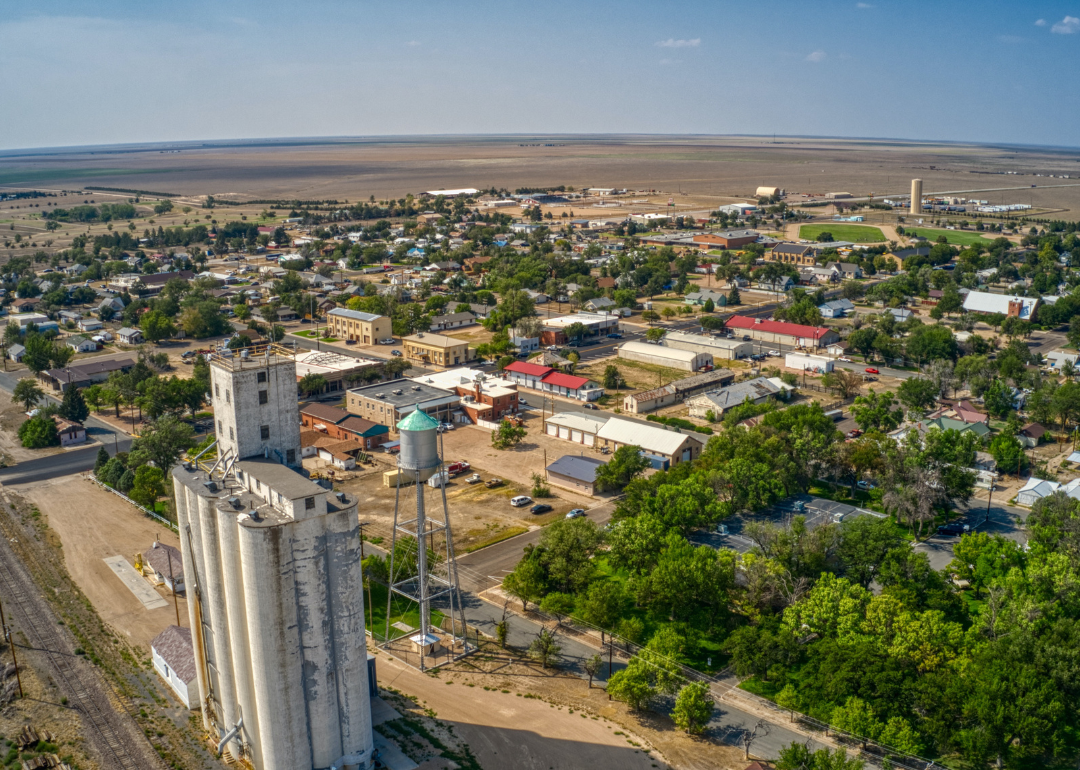
- Most conservative county: Lincoln County
--- Republican votes in 2020: 5,150 (73.2%)
--- Total votes cast: 7,033
Located in Washington's eastern region, Lincoln County is the state's second-largest wheat producer, with over 80% of the county's 2,310 square miles devoted to farmland. The county is sparsely populated, with a population density of 4.7 people per square mile, and its residents have a somewhat high median age of 47.1, with 25.1% of the population 65 or older. Lincoln's population is 89.2% white, and the county has the highest concentration of white Christians in the state at 67%.
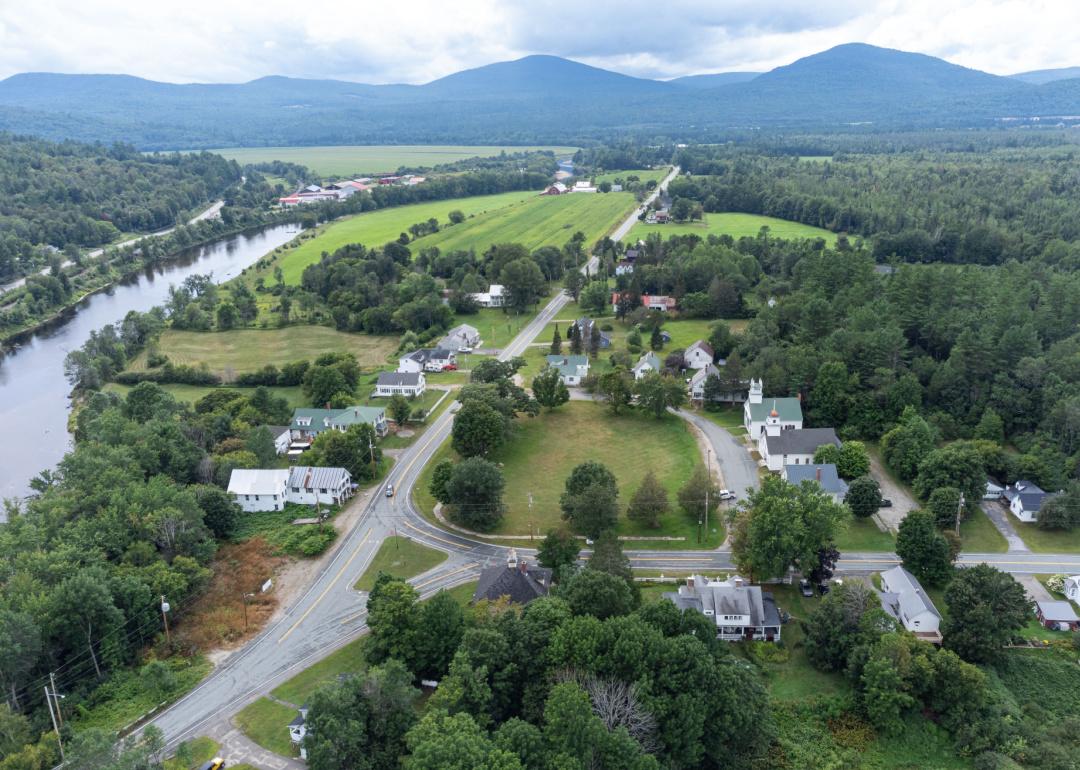
#3. Vermont: 32% liberal, 28% conservative
- Most conservative county: Essex County
--- Republican votes in 2020: 1,773 (53.9%)
--- Total votes cast: 3,288
The least populous county of Vermont and in all of New England, Essex County has 5,920 residents, of whom 94% are white, and 67% of whom identify as white Christians, the third-highest concentration in the state. Essex also has the lowest median household income in the state at $48,194 against Vermont's overall $72,431.

#2. Maine: 33% liberal, 35% conservative
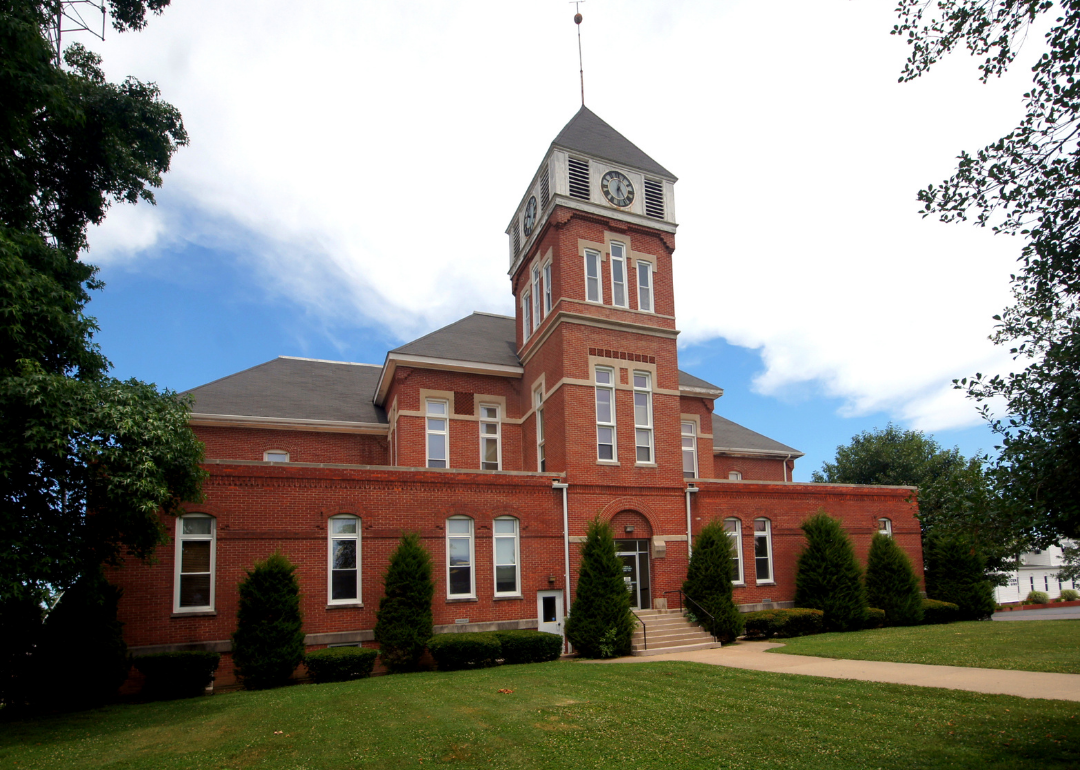
- Most conservative county: Piscataquis County
--- Republican votes in 2020: 6,143 (62.0%)
--- Total votes cast: 9,908
With water representing 9.5% of its area, and a significant portion of its land devoted to state parks, preserves, and wilderness areas, Piscataquis County is a largely rural, natural region. The second-largest county in Maine at 3,961 square miles, Piscataquis' population of 16,800 has a median age of 51.3, with 26.1% of the population aged 65 and older, and 20.3% of the population having attained a bachelor's degree or higher.
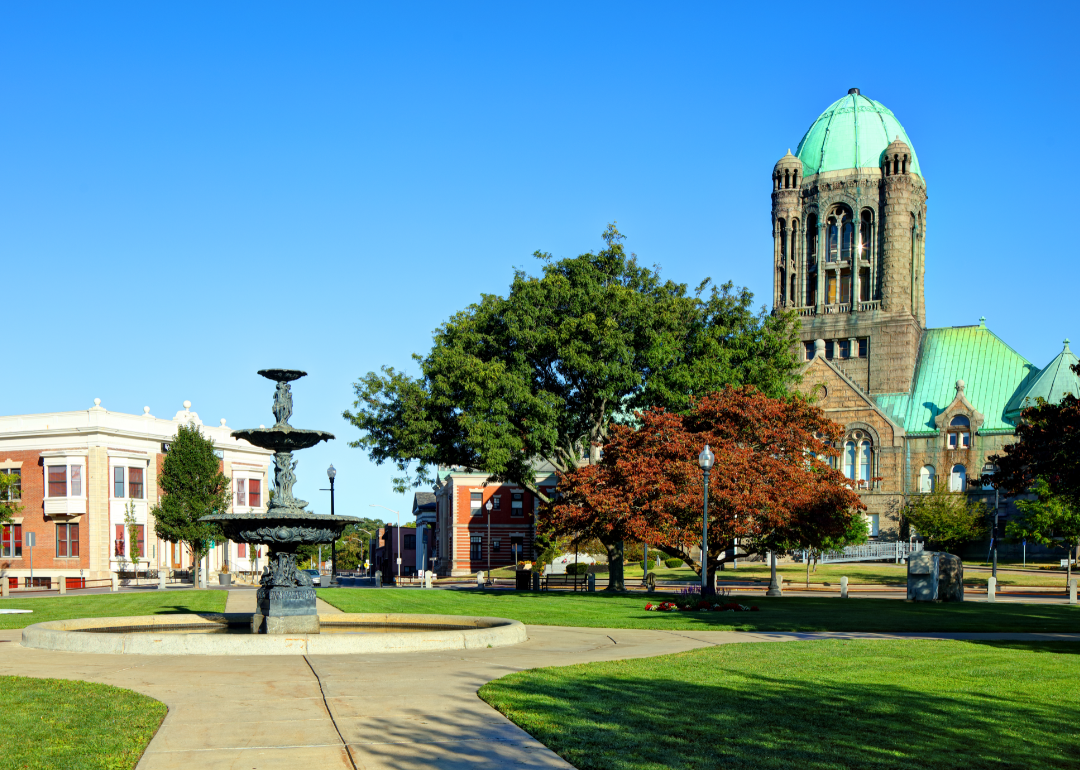
#1. Massachusetts: 35% liberal, 21% conservative
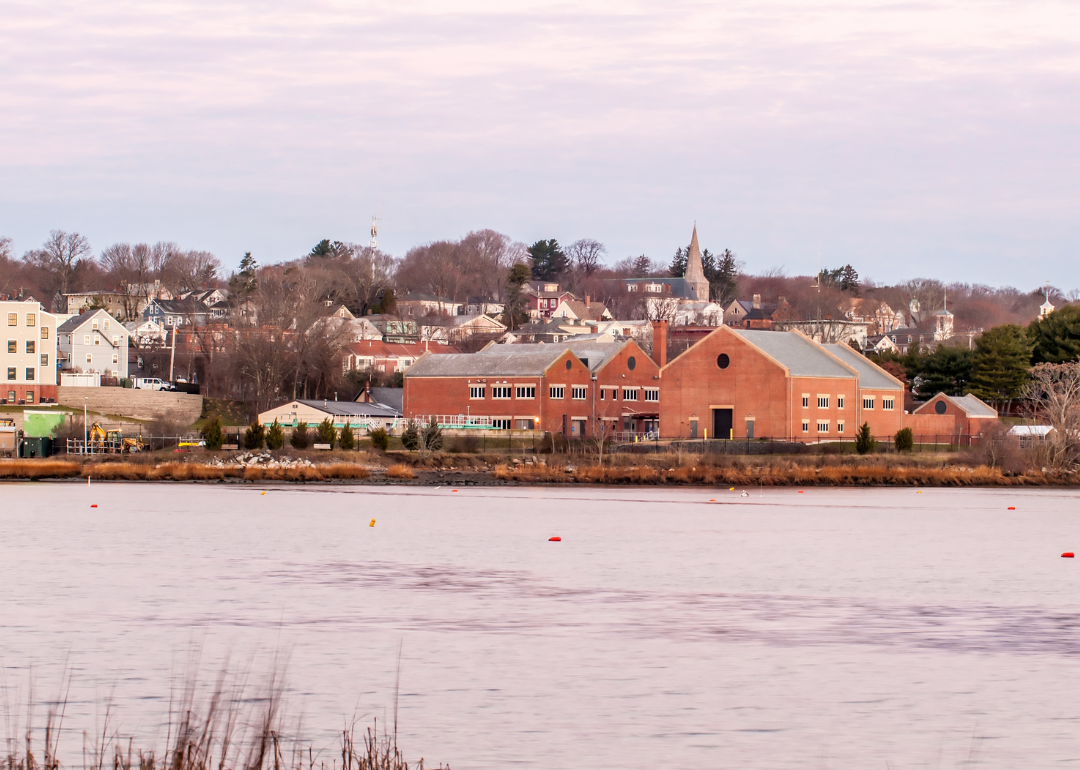
- Most conservative county: Bristol County
--- Republican votes in 2020: 119,872 (42.9%)
--- Total votes cast: 279,279
Bordering Providence, Rhode Island, and containing a high proportion of urban area, Bristol County's population is 579,200, and the county has a population density of 1,047.2 people per square mile. The county's median household income of $73,102 is above the national average but lags behind Massachusetts' median income of $89,645. Just 9.5% of the population are Hispanic or Latino, whereas 78.7% identify as white.
Data reporting by Sam Larson. Story editing by Brian Budzynski. Copy editing by Robert Wickwire.


