How do people die in U.S. traffic collisions?
In 2021, nearly 43,000 people were killed in traffic collisions in the United States. This represents a 10.5 percent increase over 2020 and the most traffic deaths in a single year since 2005.
While it's clear that U.S. roads have become increasingly more deadly in recent years, what circumstances lead to fatal crashes? Are there regional differences in how they occur?
How, exactly, do people die in motor vehicle collisions?
Morris Bart examined the latest available year of fatal crash data from the NHTSA to find answers.
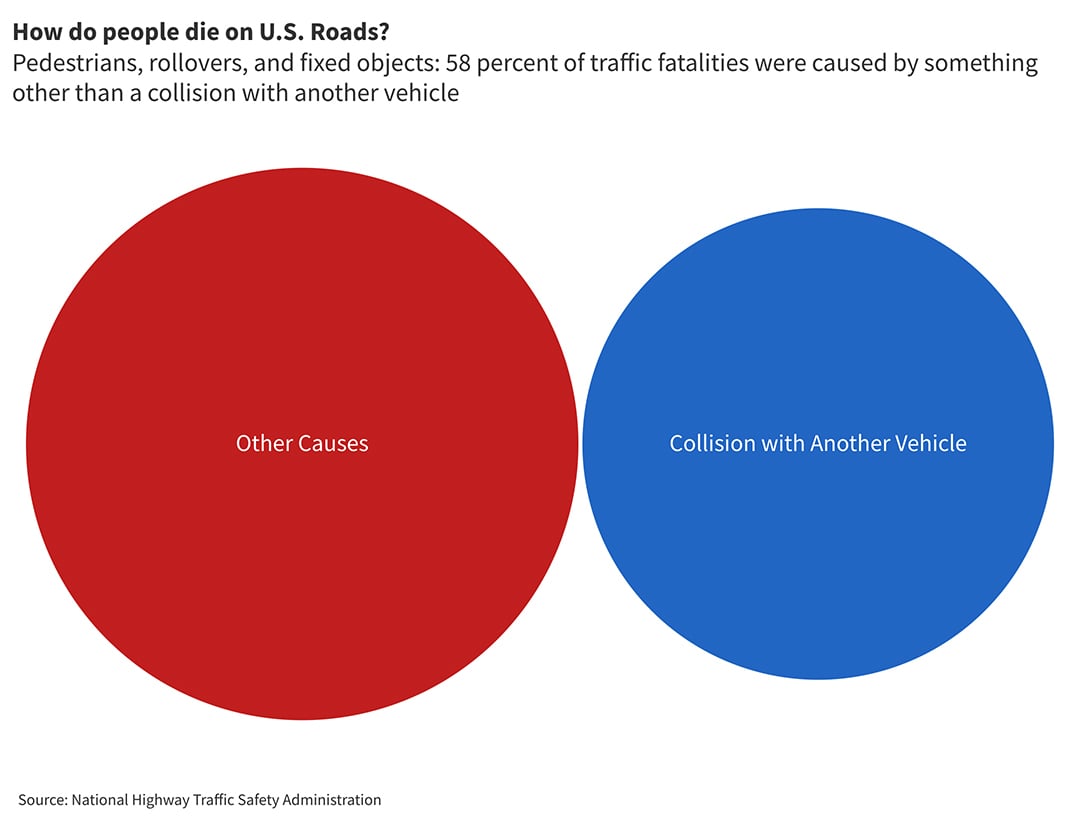
What events or objects cause the most traffic deaths?
As you might expect, collisions with other vehicles are the most common cause of traffic deaths. Vehicle collisions killed over 18,000 people in 2021 and accounted for 42 percent of all traffic deaths in the United States.
However, while motor vehicle collisions were the most common single source, the majority of traffic deaths — 58%, according to the National Highway Traffic Safety Administration's FARS database — were caused by something else.
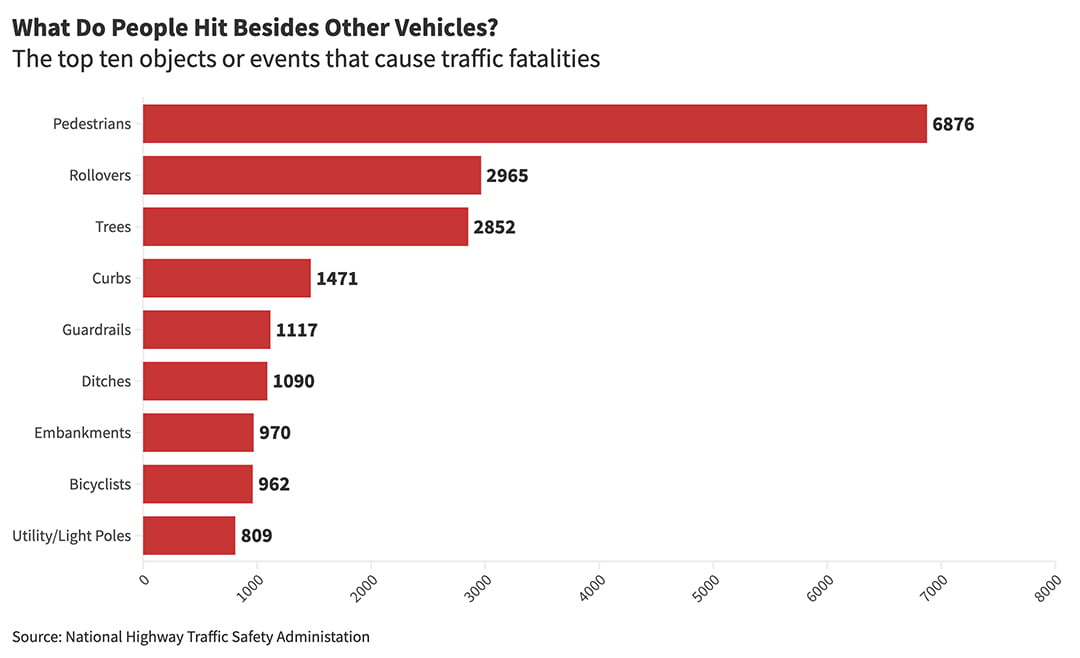
Other vehicles cause the most traffic fatalities, but there are a surprising array of other causes
The NHTSA keeps 56 different objects or events that lead to fatal crashes. This data includes collisions with fixed objects like trees, curbs, or mailboxes; incidents involving non-motorists such as pedestrians or bicyclists; and non-collision events such as vehicle rollovers.
Pedestrian crashes were the next closest cause, accounting for 6,876 deaths, followed by vehicle rollovers or overturns, then collisions with trees.
Outside the top ten, there were several interesting or surprising ways people die on the road:
- Parked Motor Vehicles: 609 people died after hitting a parked car.
- Mailboxes: 266 people were killed after colliding with a mailbox.
- Live Animal: A live animal wandering on or near a roadway resulted in 164 fatalities. Another 23 people died in collisions with a ridden animal or animal-drawn conveyance (such as a horse-drawn carriage).
- Fire Hydrants: 32 people died after a vehicle struck a fire hydrant.
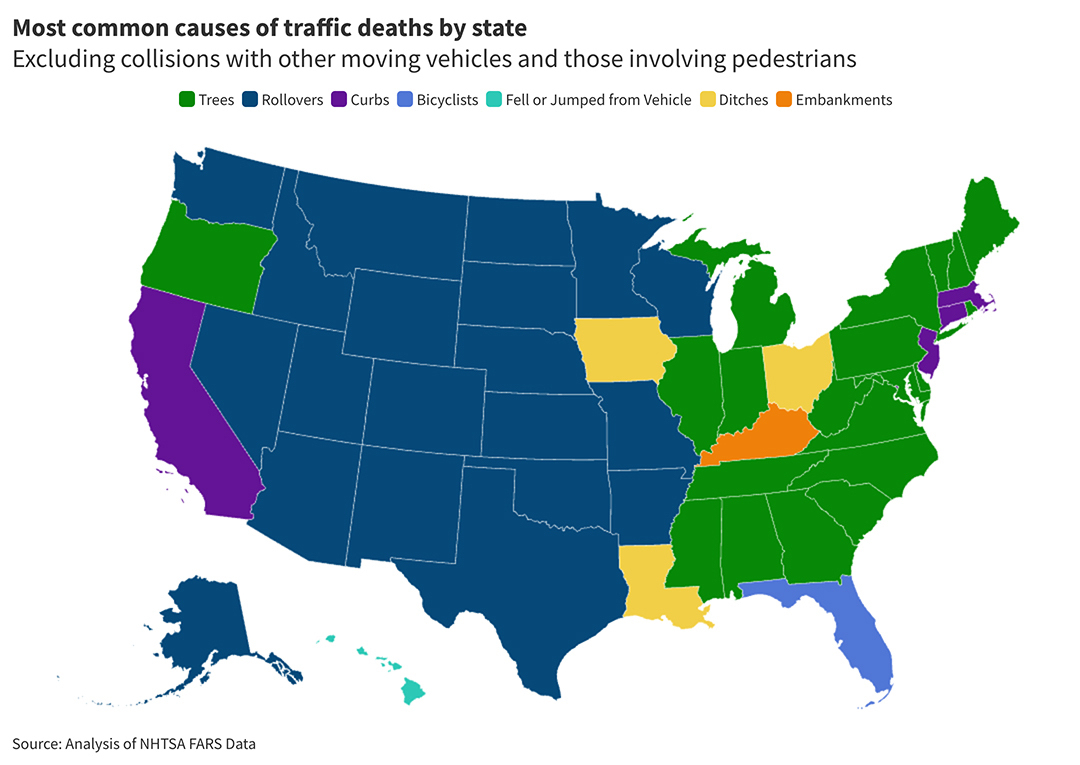
Regional differences paint an unusual picture of national road safety
In all 50 states and the District of Columbia, the most common cause of traffic deaths is either collisions with other vehicles or pedestrians. However, if we remove these crashes, some very interesting regional differences emerge. Seven different objects or events appear as the next most common cause in at least one state: rollovers, trees, curbs, ditches, embankments, bicycles, and occupants falling or jumping from vehicles.
Vehicle rollovers and overturns: Especially dangerous for large SUVs and trucks, vehicle rollovers or overturns killed nearly 3,000 people in 2021. They were the most common type of crash in outside vehicle and pedestrian collisions in twenty states, including Texas, Colorado, and Arizona.
Collisions with standing trees: While tree-lined roads have been shown to lower average traffic speed and reduce the rate of head-on collisions, trees can be dangerous fixed objects in crashes. As the fifth most common cause of crash deaths overall, collisions with standing trees took the lives of 2,852 people. Tree-related crashes were the most common cause of death in twenty states, including most of the states along the East Coast.
Curbs: While striking a curb may immediately bring visions of wheel damage to mind, curbs can be dangerous fixed objects. In fact, nearly 1,500 people were killed in traffic crashes caused by collisions with curbs. They were most common in four states - California, Connecticut, Massachusetts, and New Jersey - and the District of Columbia.
Ditches: Ditches are essential to road safety, carrying rainwater away from the road and preventing them from flooding. However, when motorists veer off the road and into a roadside ditch, it can be disastrous. Just under 11,000 people died after their vehicles veered into a ditch and they were most common in three states - Iowa, Louisiana, and Ohio.
Embankments: Embankments are raised structures used to hold back water or, most commonly along highways and overpasses, carry a roadway. Nearly 1,000 people died after striking an embankment along a roadway. Collisions with embankments were the leading cause of road deaths in one state - Kentucky.
Bicyclists: In Florida, collisions with bicyclists killed more people than any other type of collision outside those involving other vehicles or pedestrians. In fact, 20 percent of all bicycle deaths (195) occurred in the state of Florida.
Fell or jumped from vehicle: In Hawaii, seven people died after falling or jumping from a moving vehicle, accounting for seven percent of all traffic deaths in the state.
The most common cause of fatal crashes in each state
Below, we list the most common events or objects that cause fatal crashes in the U.S., outside collisions with pedestrians and other vehicles.
Alabama
Cause: Trees
Fatal Crashes: 4
Fatalities: 119
Percentage of all Traffic Deaths in State: 1%
Alaska
Cause: Rollovers
Fatal Crashes: 6
Fatalities: 6
Percentage of all Traffic Deaths in State: 9%
Arizona
Cause: Rollovers
Fatal Crashes: 98
Fatalities: 107
Percentage of all Traffic Deaths in State: 9%
Arkansas
Cause: Rollovers
Fatal Crashes: 68
Fatalities: 71
Percentage of all Traffic Deaths in State: 10%
California
Cause: Curbs
Fatal Crashes: 281
Fatalities: 307
Percentage of all Traffic Deaths in State: 7%
Colorado
Cause: Rollovers
Fatal Crashes: 77
Fatalities: 80
Percentage of all Traffic Deaths in State: 12%
Connecticut
Cause: Curbs
Fatal Crashes: 24
Fatalities: 27
Percentage of all Traffic Deaths in State: 9%
Delaware
Cause: Trees
Fatal Crashes: 11
Fatalities: 11
Percentage of all Traffic Deaths in State: 8%
District of Columbia
Cause: Curbs
Fatal Crashes: 4
Fatalities: 4
Percentage of all Traffic Deaths in State: 10%
Florida
Cause: Bicyclists
Fatal Crashes: 195
Fatalities: 195
Percentage of all Traffic Deaths in State: 5%
Georgia
Cause: Trees
Fatal Crashes: 155
Fatalities: 167
Percentage of all Traffic Deaths in State: 9%
Hawaii
Cause: Fell or Jumped from Vehicle
Fatal Crashes: 7
Fatalities: 7
Percentage of all Traffic Deaths in State: 7%
Idaho
Cause: Rollovers
Fatal Crashes: 58
Fatalities: 58
Percentage of all Traffic Deaths in State: 21%
Illinois
Cause: Trees
Fatal Crashes: 72
Fatalities: 80
Percentage of all Traffic Deaths in State: 6%
Indiana
Cause: Trees
Fatal Crashes: 65
Fatalities: 70
Percentage of all Traffic Deaths in State: 8%
Iowa
Cause: Ditches
Fatal Crashes: 50
Fatalities: 51
Percentage of all Traffic Deaths in State: 14%
Kansas
Cause: Rollovers
Fatal Crashes: 41
Fatalities: 45
Percentage of all Traffic Deaths in State: 11%
Kentucky
Cause: Embankment
Fatal Crashes: 72
Fatalities: 74
Percentage of all Traffic Deaths in State: 9%
Louisiana
Cause: Ditches
Fatal Crashes: 72
Fatalities: 73
Percentage of all Traffic Deaths in State: 8%
Maine
Cause: Trees
Fatal Crashes: 31
Fatalities: 33
Percentage of all Traffic Deaths in State: 22%
Maryland
Cause: Trees
Fatal Crashes: 41
Fatalities: 47
Percentage of all Traffic Deaths in State: 8%
Massachusetts
Cause: Curbs
Fatal Crashes: 33
Fatalities: 33
Percentage of all Traffic Deaths in State: 8%
Michigan
Cause: Trees
Fatal Crashes: 113
Fatalities: 119
Percentage of all Traffic Deaths in State: 10%
Minnesota
Cause: Rollovers
Fatal Crashes: 78
Fatalities: 82
Percentage of all Traffic Deaths in State: 17%
Mississippi
Cause: Trees
Fatal Crashes: 84
Fatalities: 90
Percentage of all Traffic Deaths in State: 12%
Missouri
Cause: Rollovers
Fatal Crashes: 98
Fatalities: 100
Percentage of all Traffic Deaths in State: 10%
Montana
Cause: Rollovers
Fatal Crashes: 45
Fatalities: 47
Percentage of all Traffic Deaths in State: 20%
Nebraska
Cause: Rollovers
Fatal Crashes: 30
Fatalities: 32
Percentage of all Traffic Deaths in State: 14%
Nevada
Cause: Rollovers
Fatal Crashes: 40
Fatalities: 41
Percentage of all Traffic Deaths in State: 11%
New Hampshire
Cause: Trees
Fatal Crashes: 16
Fatalities: 18
Percentage of all Traffic Deaths in State: 15%
New Jersey
Cause: Curbs
Fatal Crashes: 49
Fatalities: 55
Percentage of all Traffic Deaths in State: 8%
New Mexico
Cause: Rollovers
Fatal Crashes: 83
Fatalities: 95
Percentage of all Traffic Deaths in State: 20%
New York
Cause: Trees
Fatal Crashes: 89
Fatalities: 94
Percentage of all Traffic Deaths in State: 8%
North Carolina
Cause: Trees
Fatal Crashes: 150
Fatalities: 160
Percentage of all Traffic Deaths in State: 10%
North Dakota
Cause: Rollovers
Fatal Crashes: 20
Fatalities: 21
Percentage of all Traffic Deaths in State: 21%
Ohio
Cause: Ditches
Fatal Crashes: 72
Fatalities: 77
Percentage of all Traffic Deaths in State: 6%
Oklahoma
Cause: Rollovers
Fatal Crashes: 81
Fatalities: 86
Percentage of all Traffic Deaths in State: 11%
Oregon
Cause: Trees
Fatal Crashes: 54
Fatalities: 58
Percentage of all Traffic Deaths in State: 10%
Pennsylvania
Cause: Trees
Fatal Crashes: 89
Fatalities: 93
Percentage of all Traffic Deaths in State: 8%
Rhode Island
Cause: Trees
Fatal Crashes: 8
Fatalities: 10
Percentage of all Traffic Deaths in State: 16%
South Carolina
Cause: Trees
Fatal Crashes: 122
Fatalities: 129
Percentage of all Traffic Deaths in State: 11%
South Dakota
Cause: Rollovers
Fatal Crashes: 34
Fatalities: 36
Percentage of all Traffic Deaths in State: 24%
Tennessee
Cause: Trees
Fatal Crashes: 112
Fatalities: 117
Percentage of all Traffic Deaths in State: 9%
Texas
Cause: Rollovers
Fatal Crashes: 318
Fatalities: 337
Percentage of all Traffic Deaths in State: 7%
Utah
Cause: Rollovers
Fatal Crashes: 42
Fatalities: 45
Percentage of all Traffic Deaths in State: 14%
Vermont
Cause: Trees
Fatal Crashes: 10
Fatalities: 11
Percentage of all Traffic Deaths in State: 15%
Virginia
Cause: Trees
Fatal Crashes: 110
Fatalities: 117
Percentage of all Traffic Deaths in State: 12%
Washington
Cause: Rollovers
Fatal Crashes: 46
Fatalities: 48
Percentage of all Traffic Deaths in State: 7%
West Virginia
Cause: Trees
Fatal Crashes: 26
Fatalities: 27
Percentage of all Traffic Deaths in State: 10%
Wisconsin
Cause: Rollovers
Fatal Crashes: 66
Fatalities: 67
Percentage of all Traffic Deaths in State: 11%
Wyoming
Cause: Rollovers
Fatal Crashes: 26
Fatalities: 28
Percentage of all Traffic Deaths in State: 25%
Data sources and methodology
This analysis is based on Fatality Analysis Reporting System (FARS) data from the National Highway Traffic Safety Administration for 2021 - the latest available year. FARS contains data on a census of fatal crashes within the 50 states and the District of Columbia. Vehicle collision causes are based on the First Harmful Event (FHE) field, defined by the NHTSA as the first injury or damage-producing event in each crash.
This story was produced by Morris Bart and reviewed and distributed by Stacker Media.