America's top 1% is different in each state: From a $370k to $950K income
America's top 1% is different in each state: From a $370k to $950K income
American wealth is becoming increasingly concentrated at the very top of the economic ladder. The top 1% of families hold over a third of the total wealth in the U.S. – up from 27% in 1989 – according to a Congressional Budget Office report from 2022. The bottom half of all households, meanwhile, control just 2% of the total wealth.
But who's in this group of ultra wealthy taxpayers? Nationally, households that make $652,657 are considered among the top 1%. They earn more than eight times as much as the median household, which sits around $75,000.
However, the 1% threshold varies from state to state, ranging from as much as $953,000 to as little as $368,000. SmartAsset analyzed data from the IRS and Bureau of Labor Statistics to determine the minimum income required to be among the top 1% of earners in each state.
Key Findings
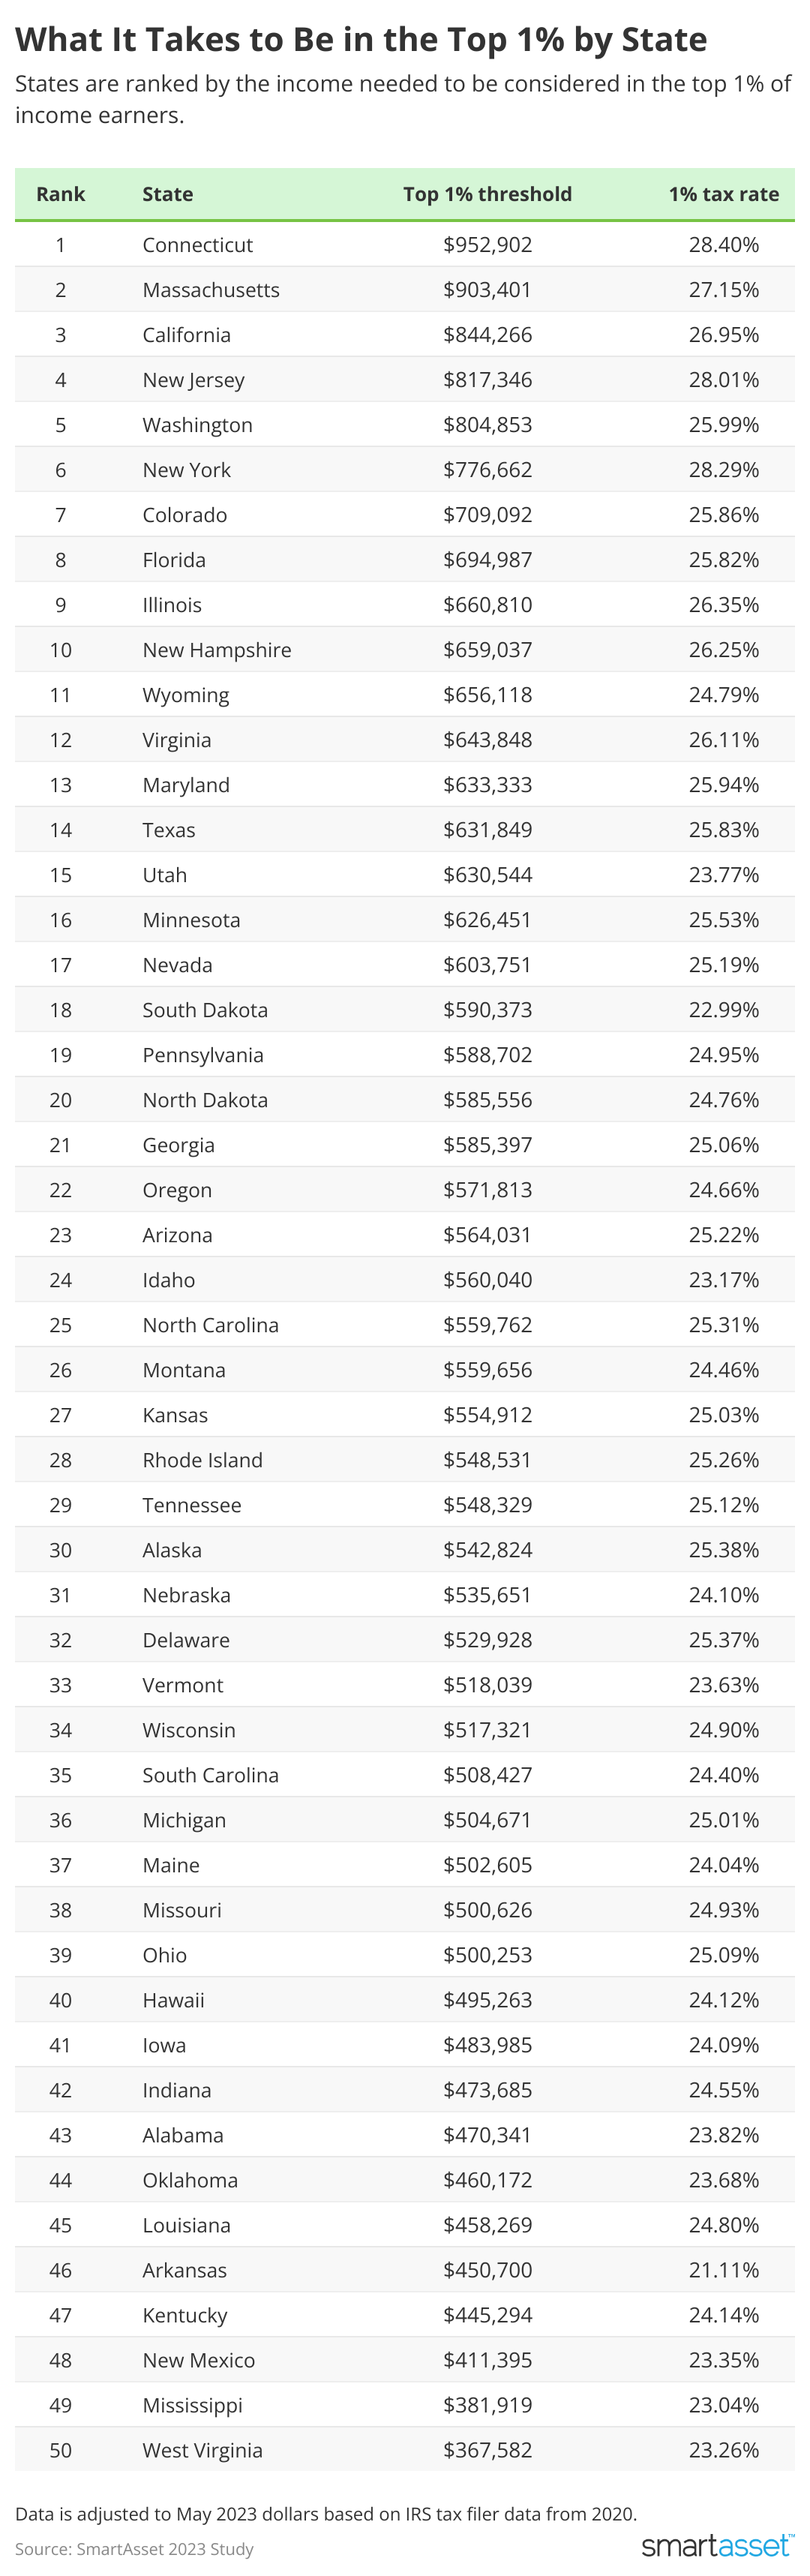
- Connecticut has the highest floor for the top 1%. You need to earn a whopping $952,902 to be in the top 1% of households in Connecticut – more than any other state in 2023. Massachusetts ($903,401) and California ($844,266) have the second- and third-highest thresholds for entering the top 1%, respectively.
- Washington D.C.'s top 1% earn more than $1 million. If our nation's capital were a state, it would rank No. 1 overall in the study. That's because households aren't considered part of the top 1% if they don't earn at least $1,013,698 in 2023.
- Southern states have the lowest income thresholds. While Northeastern states like Massachusetts and New Jersey have some of the highest income thresholds for the 1%, it takes considerably less income to be considered in the top 1% in many Southern states. For example, residents in West Virginia need just $367,582 to reach the top 1% – the least amount of income across the study. Six of the 10 states with the lowest income thresholds are located in the Southeast.
- Where the top 1% pays the most and least in taxes. Connecticut is home to the highest effective tax rate for top earners (28.4%). On the other hand, Arkansas taxes the top 1% at an average rate of just 21.11% – less than any other state.
- Income thresholds vary in America's four largest states. It takes $844,266 and $776,662 to be in the top 1% in California and New York, respectively. But households in Florida and Texas need to earn much less to be considered among the top 1% – $694,987 and $631,849, respectively.
The Top 10 States for the Top 1%
1. Connecticut
The Constitution State is one of two states where households must earn more than $900,000 per year to reach the top 1%. In 2023, the ultra-wealthy group of households make $952,902 – $300,000 more than the national average. Meanwhile, the top 1% pays the highest effective tax rate across the study (28.4%).
2. Massachusetts
You're in the top 1% in Massachusetts if your household earns at least $903,401 per year. These high earners are subject to a 27.15% effective tax rate – fourth highest across the study. Zooming out, only households that earn at least $347,809 per year are considered among the top 5%. That's the highest 5% threshold of any state.
3. California
The most populous state in the country has the third-highest threshold for the top 1% of taxpayers. In 2023, households earning at least $844,266 per year are considered among California's top 1%. On average, these high earners are taxed at a rate of 26.95%.
4. New Jersey
In the Garden State, you'll need an annual household income of $817,346 to be in the top 1%. Taxpayers at the very top of the income ladder pay an average effective tax rate of 28.01% – third highest across the study. Meanwhile, New Jersey also has the second-highest floor for the top 5% – $333,114.
5. Washington
Washington is the fifth and final state in which households must earn at least $800,000 per year to be considered in the top 1%. In the Evergreen State, households that make $804,853 are among the top 1% in 2023. These high earners are taxed at an average rate of 25.99%, thanks in part to no state income tax in Washington.
6. New York
New York residents earning over $776,662 in 2023 are considered part of the top 1%, while the threshold for the top 5% is significantly lower at $276,092. The top 1% of taxpayers in the Empire State are taxed at an average rate of 28.29%, which is second-highest across the country.
7. Colorado
In Colorado, you'll need to earn at least $709,092 in 2023 to be considered among the top 1% of taxpayers. These high earners pay an average tax rate of 25.86% – 11th highest across the study. However, you need to earn more money in Colorado – $293,083 – than you do in New York to enter the top 5% income bracket.
8. Florida
Like Washington, Florida is one of nine states that doesn't levy income taxes. As a result, the top 1% of households in the Sunshine State are taxed at an average rate of 25.82%, lower than 12 other states. To reach the top 1% in Florida, households must earn $694,987 in 2023. The income threshold for reaching the top 5% is much lower – $242,996. In fact, that's less than 17 other states.
9. Illinois
In the Land of Lincoln, households must earn at least $660,810 to be among the top 1%. Those at the very top of the income ladder in Illinois are taxed at an average rate of 26.35% – fifth highest across the study.
10. New Hampshire
The top 1% of households in New Hampshire earn at least $659,037 in 2023 and get taxed at an average rate of 26.25%. While the Granite State doesn't tax wages or salaries, it does levy a 5% tax on interest and dividends.
Data and Methodology
To determine the income needed to be in the top 1% of earners in each state, the study analyzed 2020 data from the IRS for individual tax filers. Figures were adjusted to May 2023 dollars using the Bureau of Labor Statistics' Consumer Price Index for All Urban Consumers (CPI-U) U.S. city average series for all items, not seasonally adjusted.
This story was produced by SmartAsset and reviewed and distributed by Stacker Media.


