
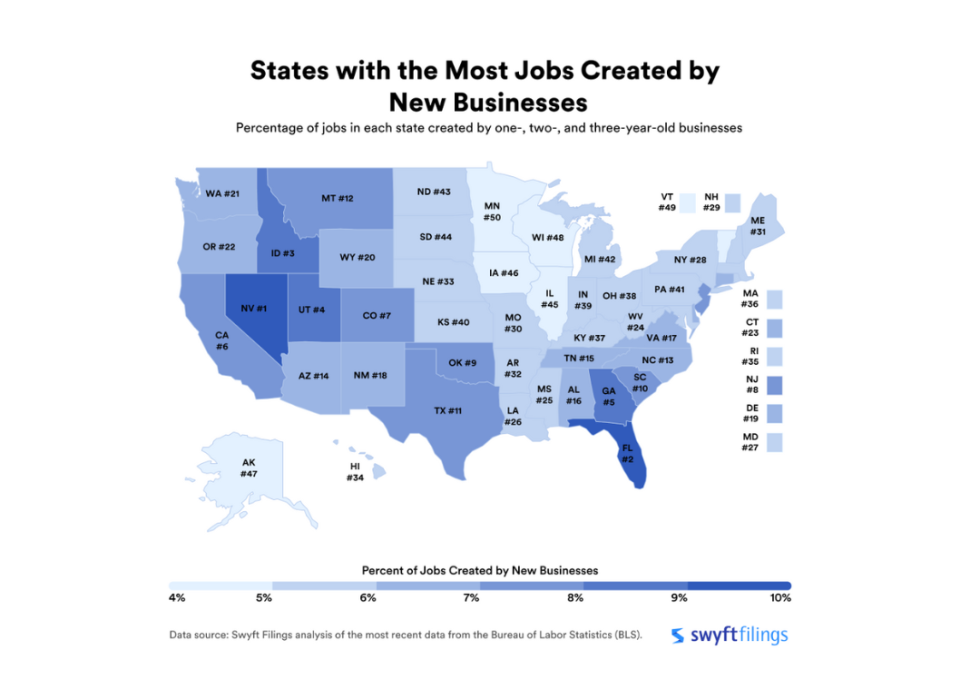
New businesses in these 10 states are creating the most new jobs
New businesses in these 10 states are creating the most new jobs
Cultivating innovation and contributing millions of jobs to the U.S. economy, new businesses are significant drivers for the nation's growth and progress. They are instrumental in revitalizing industries and communities and in creating opportunity. In fact, new businesses (between 1 and 3 years old) contributed about 1 in every 15 jobs to the economy in 2022. As new businesses set up shop, settle in, and focus on expanding, they require an increasing number of employees to meet demand and sustain growth.
The number of jobs created by new businesses varies widely from state to state, and some states significantly outpace others by this measure. To determine the top 10 states with the highest proportion of jobs from new businesses, the data and research team at Swyft Filings analyzed the most recent data published by the Bureau of Labor Statistics.
Key findings
- National averages: Among all new businesses across the nation, the average number of positions created amounts to 5.7. The number of new positions created differs depending on the age of the business. As companies grow over the first three years of operation, the employment opportunities they create tend to increase. For 1-year-old businesses, an average of 4.9 employees are hired. This number increases by about 20 percent for 2-year-old businesses to 5.9 employees and then by an additional 12 percent to 6.6 workers for 3-year-old companies.
- Regional differences: There are notable regional disparities in the contribution of new businesses to job creation across various parts of the United States. The West leads with new enterprises accounting for 7.0 percent of newly generated jobs, followed by the South at 6.7 percent. Meanwhile, the Northeast and Midwest show a lesser contribution, with new businesses there responsible for 5.8 percent and 5.1 percent of job creation, respectively.
- Nationally, 1-, 2-, and 3-year-old businesses contribute about the same number of jobs: Perhaps surprisingly, new small business endeavors lead to the steady creation of jobs across the U.S. year to year. The percentage of jobs in the United States from all new businesses is 6.64 percent, with 2.21 percent of jobs contributed by 1-year-old businesses, 2.23 percent of jobs from 2-year-old businesses, and 2.20 percent of jobs from 3-year-old businesses.
States with the most jobs created by new businesses
10. South Carolina
- Proportion of jobs created by new businesses, 2022: 7.49%
- Total jobs created by new businesses, 2022: 160,997
- Average number of employees per new business, 2022: 6
South Carolina ranks 10th in the nation with the most jobs created by new businesses. The most recent data shows that 7.49 percent of all employment opportunities in South Carolina were created by new companies. In 2022, 3-year-old businesses in South Carolina contributed 2.89 percent of all jobs in the state, the third-highest proportion of jobs contributed by 3-year-old businesses out of all other states.
9. Oklahoma
- Proportion of jobs created by new businesses, 2022: 7.63%
- Total jobs created by new businesses, 2022: 122,259
- Average number of employees per new business, 2022: 7
Coming in ninth in the study, Oklahoma saw an impressive 7.63 percent of jobs in the state created by new businesses. One-year-old businesses in Oklahoma contributed the sixth-highest proportion of jobs compared to 1-year-old businesses in all other states.
8. New Jersey
- Proportion of jobs created by new businesses, 2022: 7.81%
- Total jobs created by new businesses, 2022: 318,248
- Average number of employees per new business, 2022: 6
According to the New Jersey Department of State, 49 percent of workers are employed by small businesses. Perhaps unsurprisingly, the Garden State ranked eighth in this analysis, with 7.81 percent of all jobs created by new companies in 2022. Impressively, 2-year-old New Jersey businesses contributed 2.80 percent of all jobs to its economy, the second-highest proportion compared to businesses of the same age in all other states.
7. Colorado
- Proportion of jobs created by new businesses, 2022: 7.88%
- Total jobs created by new businesses, 2022: 218,303
- Average number of employees per new business, 2022: 5
Ranking seventh in the nation when it comes to jobs created by new businesses, is the Centennial State. In 2022, 2-year-old businesses in Colorado created the sixth-highest proportion of jobs compared to 2-year-old businesses in all other states, at 2.66 percent versus the national average of 2.23 percent.
6. California
- Proportion of jobs created by new businesses, 2022: 7.95%
- Total jobs created by new businesses, 2022: 1,405,572
- Average number of employees per new business, 2022: 4
Small businesses create two-thirds of new jobs and employ nearly half (48.5 percent) of private sector employees in California. It's therefore not surprising that the Golden State ranks sixth in the nation for the most jobs created by new businesses. In 2022, 2-year-old businesses in California created the fourth-highest proportion of jobs compared to businesses of the same tenure in all other states, at 2.72 percent compared to the national average of 2.23 percent.
5. Georgia
- Proportion of jobs created by new businesses, 2022: 8.09%
- Total jobs created by new businesses, 2022: 375,095
- Average number of employees per new business, 2022: 7
According to the Small Business Majority, Georgia's 1.2 million small businesses equal 99.6 percent of all businesses in the state, employing nearly half of all Georgia employees. Of all jobs in Georgia, 8.09 percent were created by new companies. In 2022, 1-year-old businesses in Georgia created the fifth-highest proportion of jobs compared to 1-year-old businesses in all other states, at 2.80 percent, versus the national average of 2.21 percent.
4. Utah
- Proportion of jobs created by new businesses, 2022: 8.47%
- Total jobs created by new businesses, 2022: 137,857
- Average number of employees per new business, 2022: 6
Coming in fourth in the ranking is Utah. Of all jobs created in the state, 8.47 percent were a result of new businesses. In 2022, 3-year-old businesses in Utah created the highest proportion of jobs compared to 3-year-old businesses in all other states, at 3.14 percent, versus the national average of 2.20 percent.
3. Idaho
- Proportion of jobs created by new businesses, 2022: 8.49%
- Total jobs created by new businesses, 2022: 68,435
- Average number of employees per new business, 2022: 5
In 2022, according to the Idaho Department of Labor, the state had significantly more startups relative to the local labor force than the nation overall. As a result, it may come as no surprise that the Gem State ranks third on the list this year. Of employment opportunities created in the state, 8.49 percent came from new companies. In 2022, Idaho had the third-highest proportion of jobs created by businesses formed in 2020 and 2021 compared to all other states (2.94 percent and 2.72 percent in Idaho, respectively).
2. Florida
- Proportion of jobs created by new businesses, 2022: 9.02%
- Total jobs created by new businesses, 2022: 835,657
- Average number of employees per new business, 2022: 6
According to FloridaCommerce, the Sunshine State's private sector employment grew by 3.3 percent (+277,000 jobs) over the year in July 2023. Statistics such as this that the state placed second in the ranking. Of all 2022 jobs in Florida, a whopping 9.02 percent were created by new businesses. Florida has the highest proportion of jobs created by 1- and 2-year-old businesses compared to all other states (3.03 percent and 3.15 percent in Florida, respectively).
1. Nevada
- Proportion of jobs created by new businesses, 2022: 9.03%
- Total jobs created by new businesses, 2022: 130,315
- Average number of employees per new business, 2022: 6
Coming in first when it comes to jobs created by new businesses is Nevada. In the Silver State, an impressive 9.03 percent of all jobs in 2022 were generated by new businesses. In 2022, 3-year-old businesses in Nevada created the highest proportion of jobs compared to 3-year-old businesses in all other states, at 3.37 percent, versus the national average of 2.20 percent.
Methodology
To identify the states with the most jobs created by small businesses, the research team at Swyft Filings referred to the most recent business age and survival data published by the Bureau of Labor Statistics. In this analysis, new businesses were defined as those ranging from one to three years old. For each state, researchers at Swyft Filings calculated the proportion of jobs created by these new businesses by taking the number of employees they provided in 2022 and dividing it by the total employment in that state during the same period.
This story was produced by Swyft Filings, a business formation service, and reviewed and distributed by Stacker Media.


